First launch: iAF and your psychotype
When you connect the device for the first time, the application conducts calibration - determines your individual alpha frequency (iAF). This takes ~30 seconds with your eyes closed.
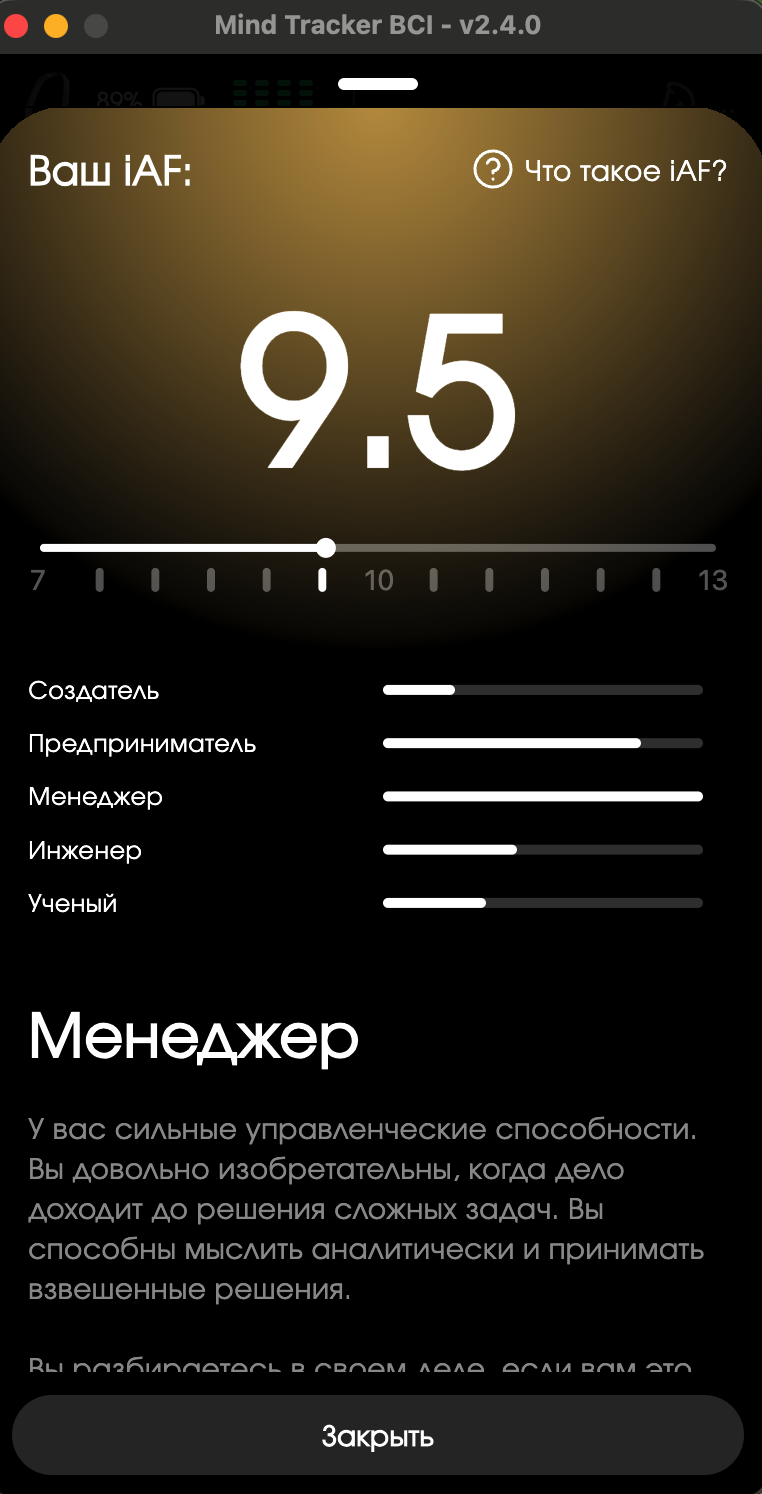
7–13 Hz scale and determination of psychotype. In the example - “Manager” (9.5 Hz)
iAF is a genetic “fingerprint” of the brain that determines your cognitive style:
| iAF range | Psychotype | Description |
|---|---|---|
| 7 – 9.5 Hz | Creator | Creative, imaginative thinking |
| 9.5 – 10.5 Hz | Manager / Entrepreneur | Management skills, analytics |
| 10.5 – 13 Hz | Engineer / Scientist | Technical, structural thinking |
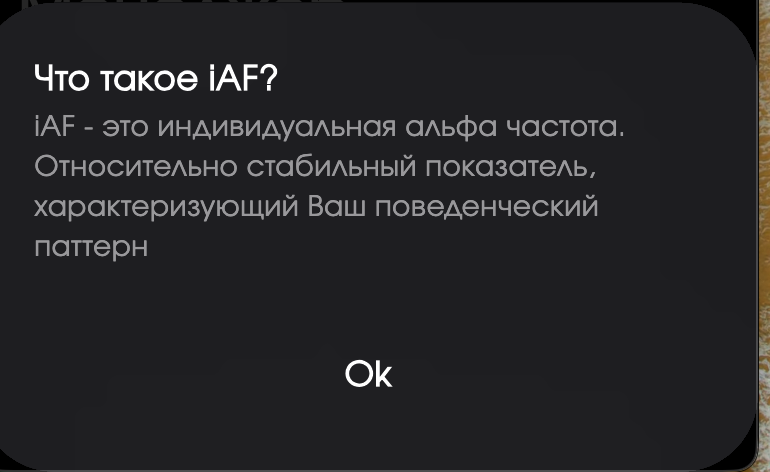
iAF is a relatively stable indicator that characterizes your behavioral pattern
Home: statistics and iAPF
The main screen shows the dynamics of your iAPF (peak alpha frequency) - How far your current readings deviate from your average.
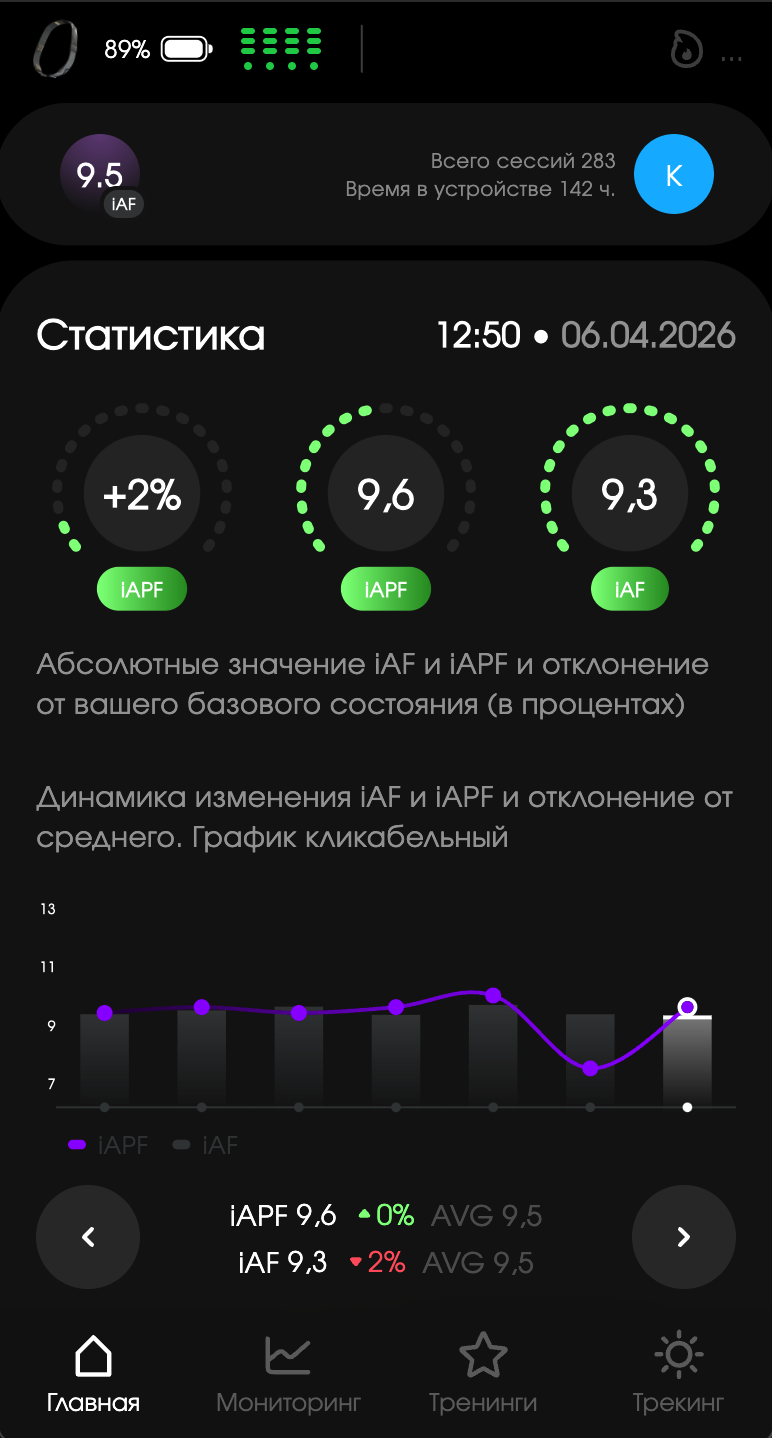
iAF and iAPF statistics, deviations from the baseline
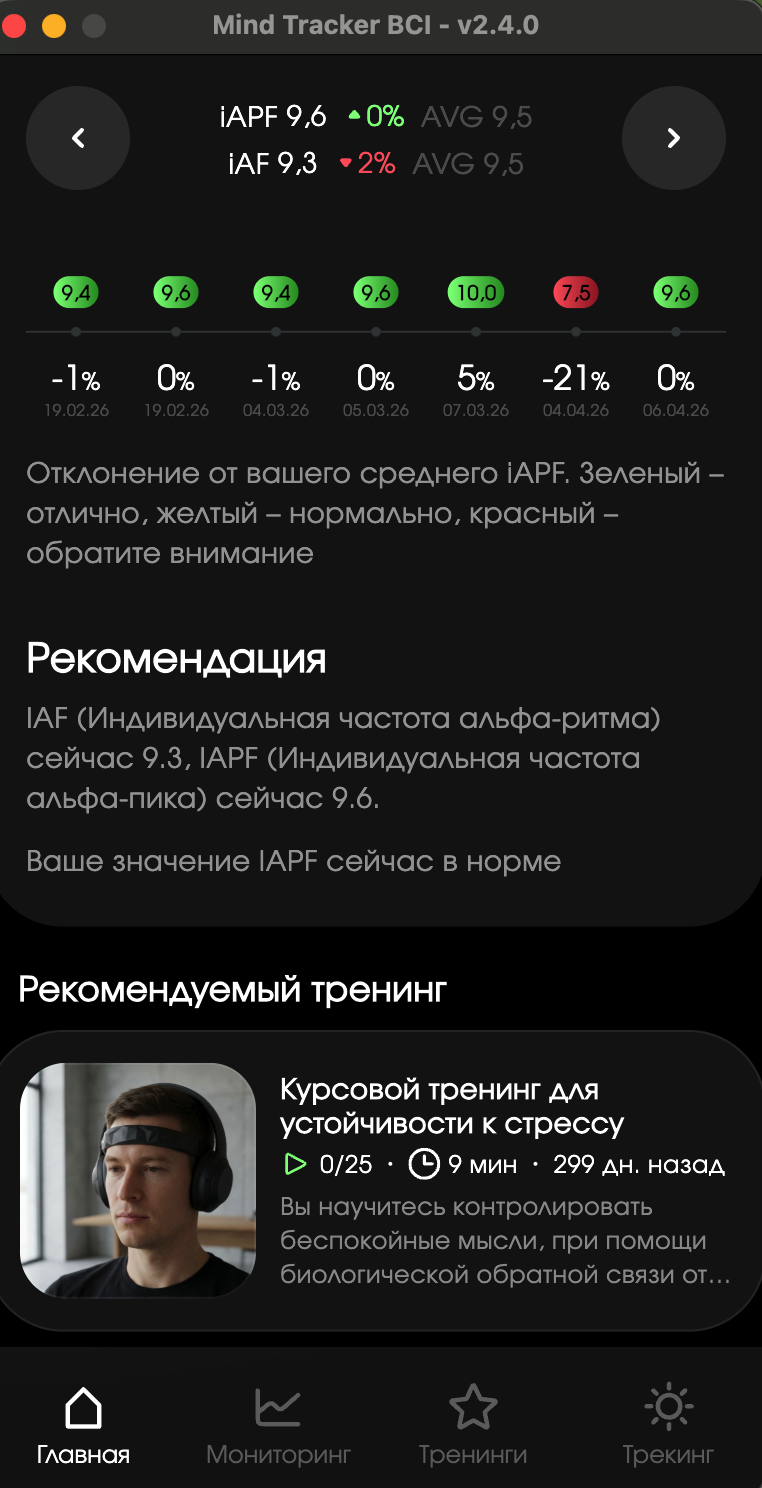
Deviation chart + recommended training
Monitoring: 3 real-time graphics
Chapter "Monitoring" - live brain panel. Simultaneously displayed 3 graphics, which you choose yourself.
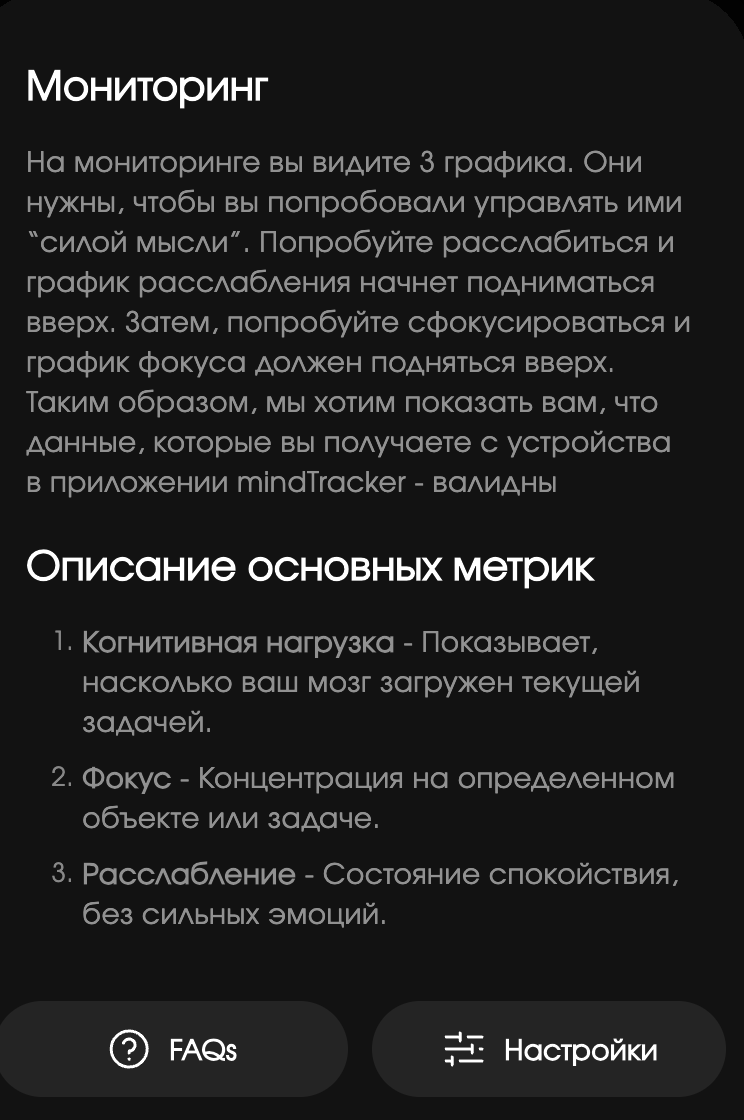
Description of the “Monitoring” section and the main metrics in the application
Selecting 3 indicators for graphs
In monitoring settings, select any 3 of 6 available metrics:
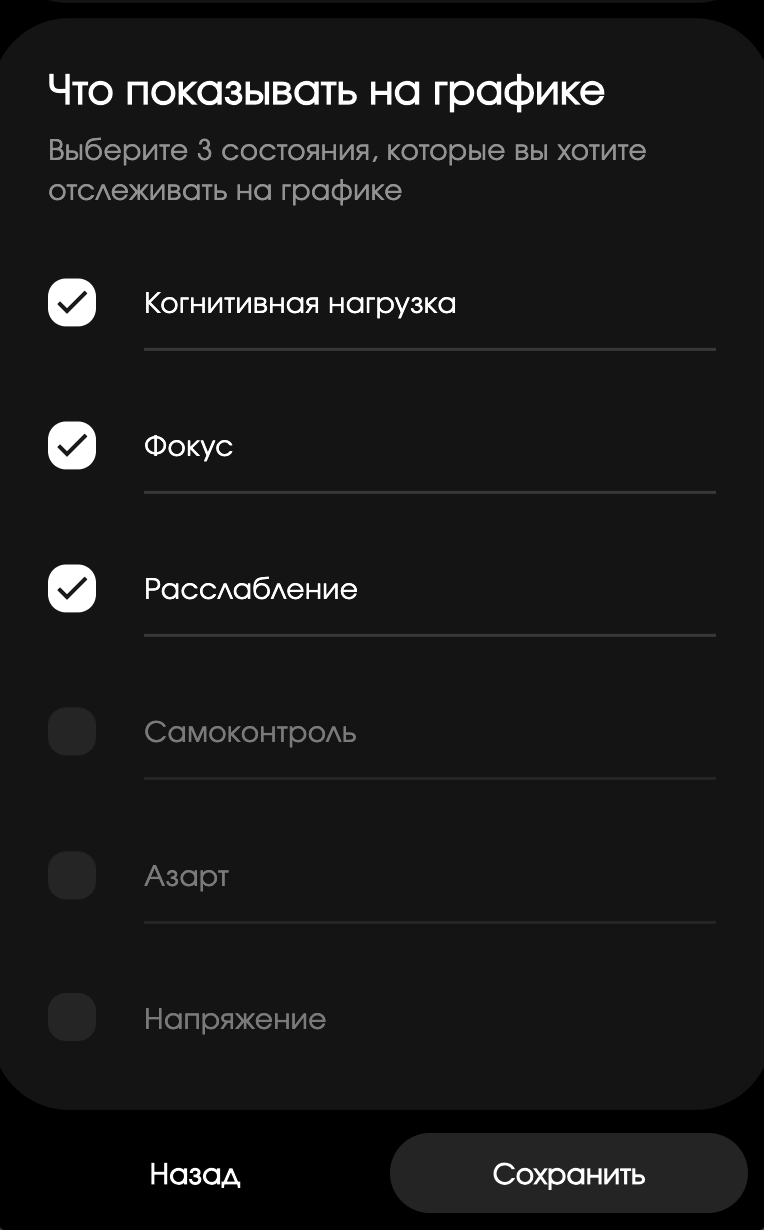
Selection screen: check the required indicators
6 available metrics for charts
| Metrics | What does it show |
|---|---|
| Cognitive load | How busy is the brain with the current task? |
| Focus | Concentration on a specific object or task |
| Relaxation | A state of calm, without strong emotions |
| Self-control | Ability to suppress distractions |
| Excitement | Internal tension or growing excitement |
| Voltage | Emotions that make it difficult to calm down |
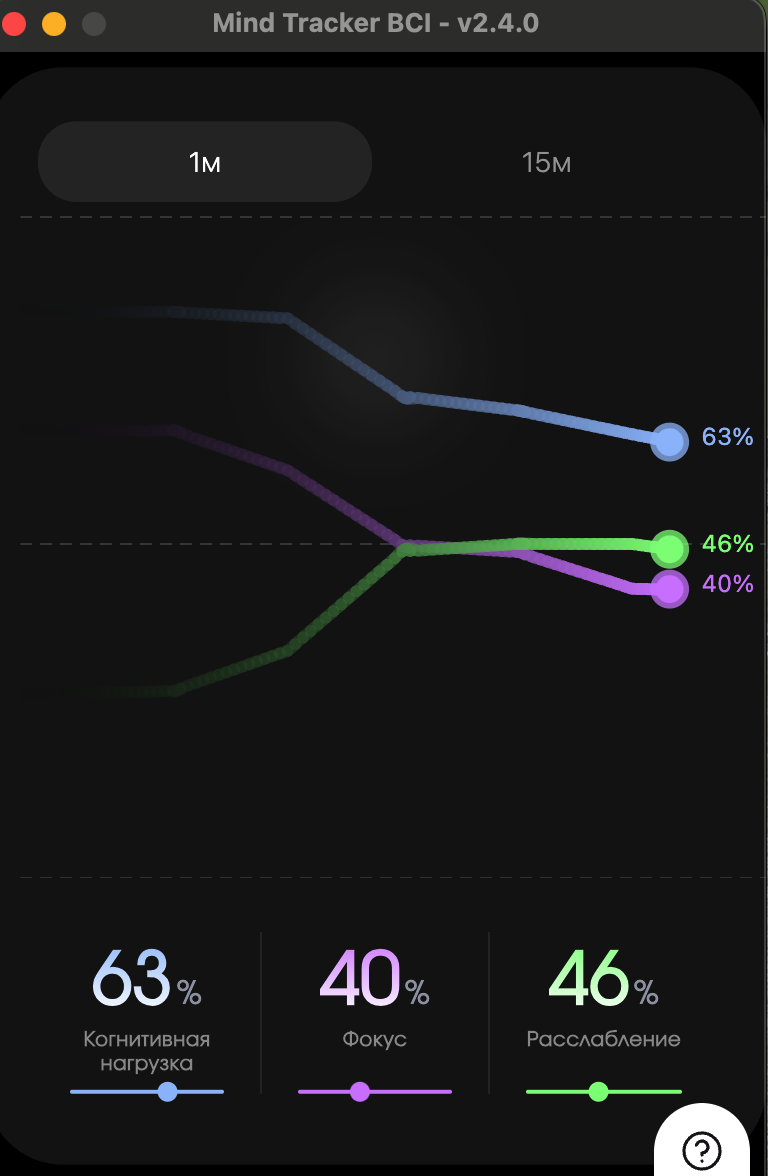
Scale 1 min: Load 63%, Focus 40%, Relaxation 46%
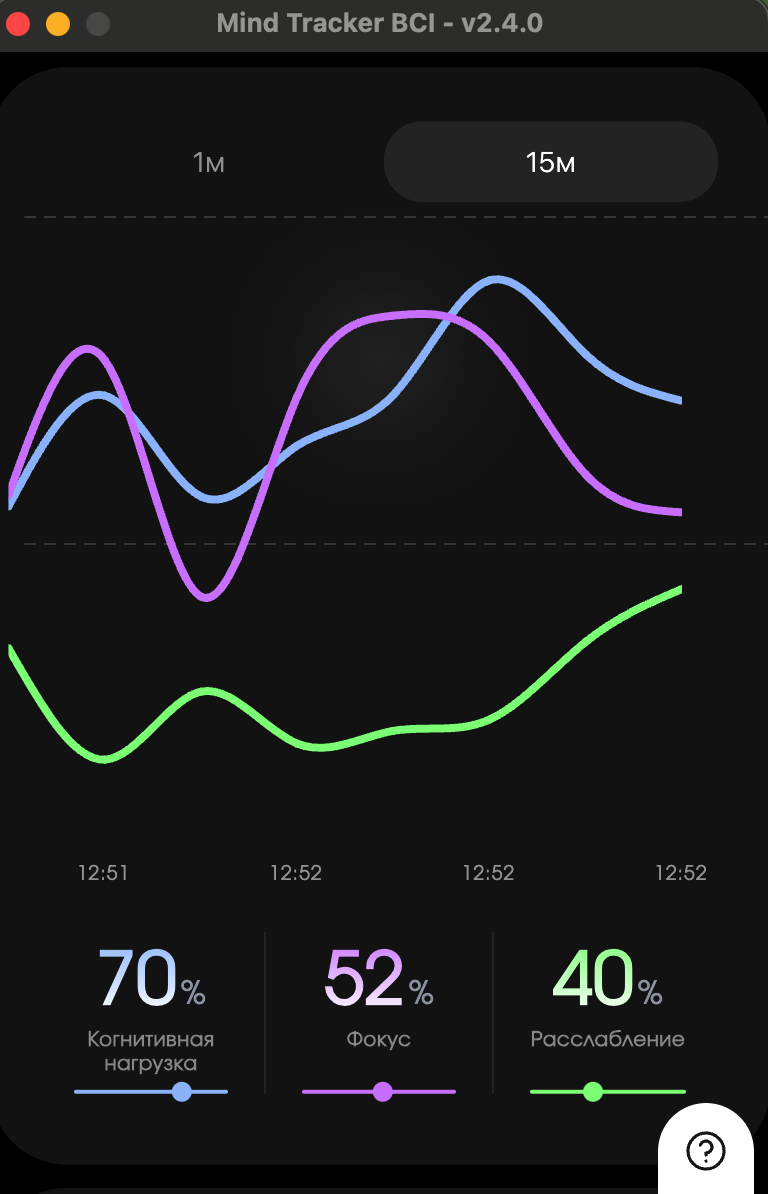
Scale 15 min: dynamics over a longer period
Recommended combinations of 3 charts
🎯 Combination 1: "Working mode"default
Cognitive load + Focus + Relaxation
Daily work, calls, tasks. Shows the balance of workload, concentration and rest. If the load is high and focus is falling, it’s time for a break.
🧠 Combination 2: “Antistress”
Relaxation + Tension + Self-control
Stressful situations, negotiations, conflicts. See in real time how tense you are and whether you can control yourself.
🎨 Combination 3: “Creative session”
Focus + Relaxation + Excitement
Brainstorming, creative tasks, idea generation. Balancing relaxation and focus is the key to a state of flow. Passion shows inner drive.
💻 Combination 4: “Deep Work”
Cognitive load + Focus + Self-control
Programming, analytics, writing texts. Self-control is more important than relaxation - it shows whether you can suppress distractions.
💤 Combination 5: “Recovery”
Relaxation + Tension + Cognitive load
Breaks, meditations, evening sessions. The goal is relaxation up, tension and load down.
Pie state diagram
In addition to 3 graphs, the application generates a general pie chart of the distribution of states per session:
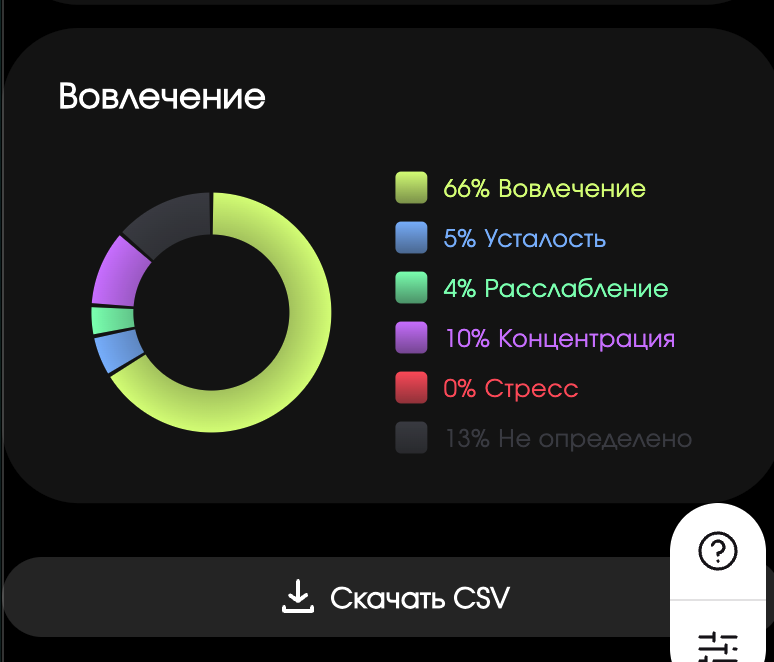
66% Engagement, 10% Concentration, 5% Fatigue, 4% Relaxation, 0% Stress. "Download CSV" button for export
Tracking: presets and averages
Chapter "Tracking" - smart tracking mode. Monitors the status and signals when indicators go beyond the established thresholds.
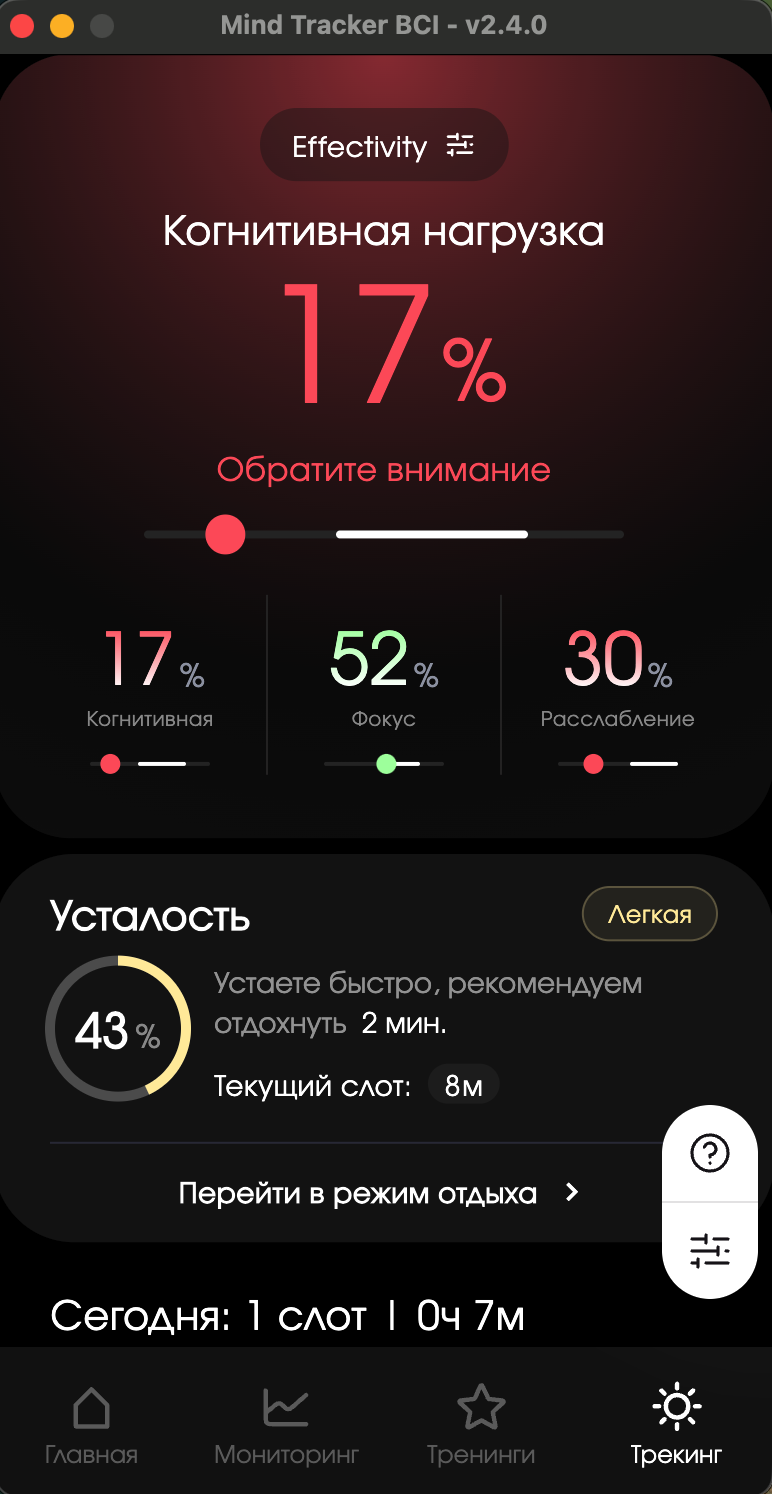
Tracking: Effectiveness preset. Load 17%, Focus 52%, Relaxation 30%. Fatigue 43% (mild)
Ready presets
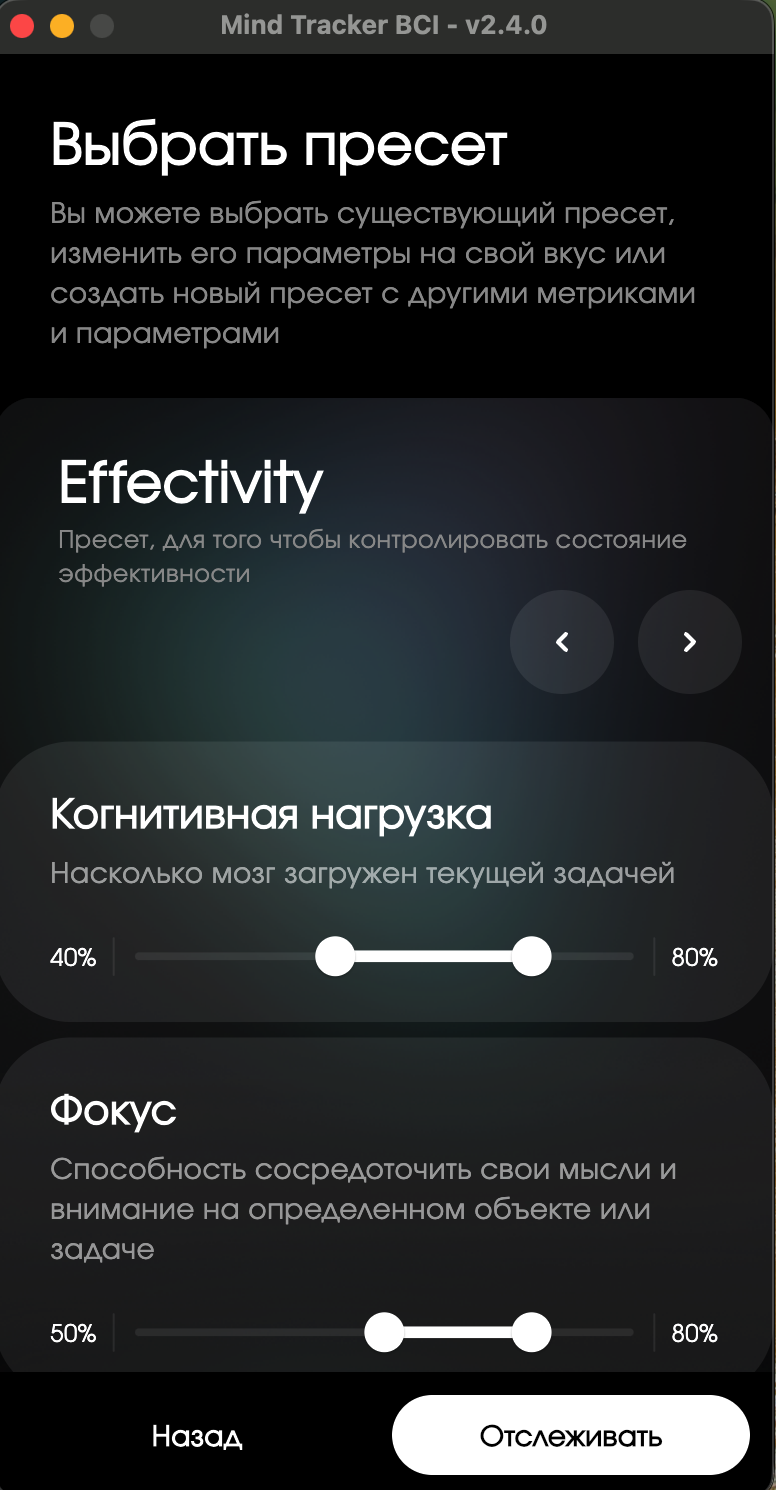
Preset selection: Effectiveness, Productivity, Education (arrows switch)
| Preset | Purpose | Key metrics |
|---|---|---|
| Effectivity | Performance monitoring | Cognitive load, Focus, Relaxation |
| Productivity | Productivity monitoring | Load, Focus, Fatigue |
| Education | Training mode | Focus, Engagement, Concentration |
Efficiency preset: average values
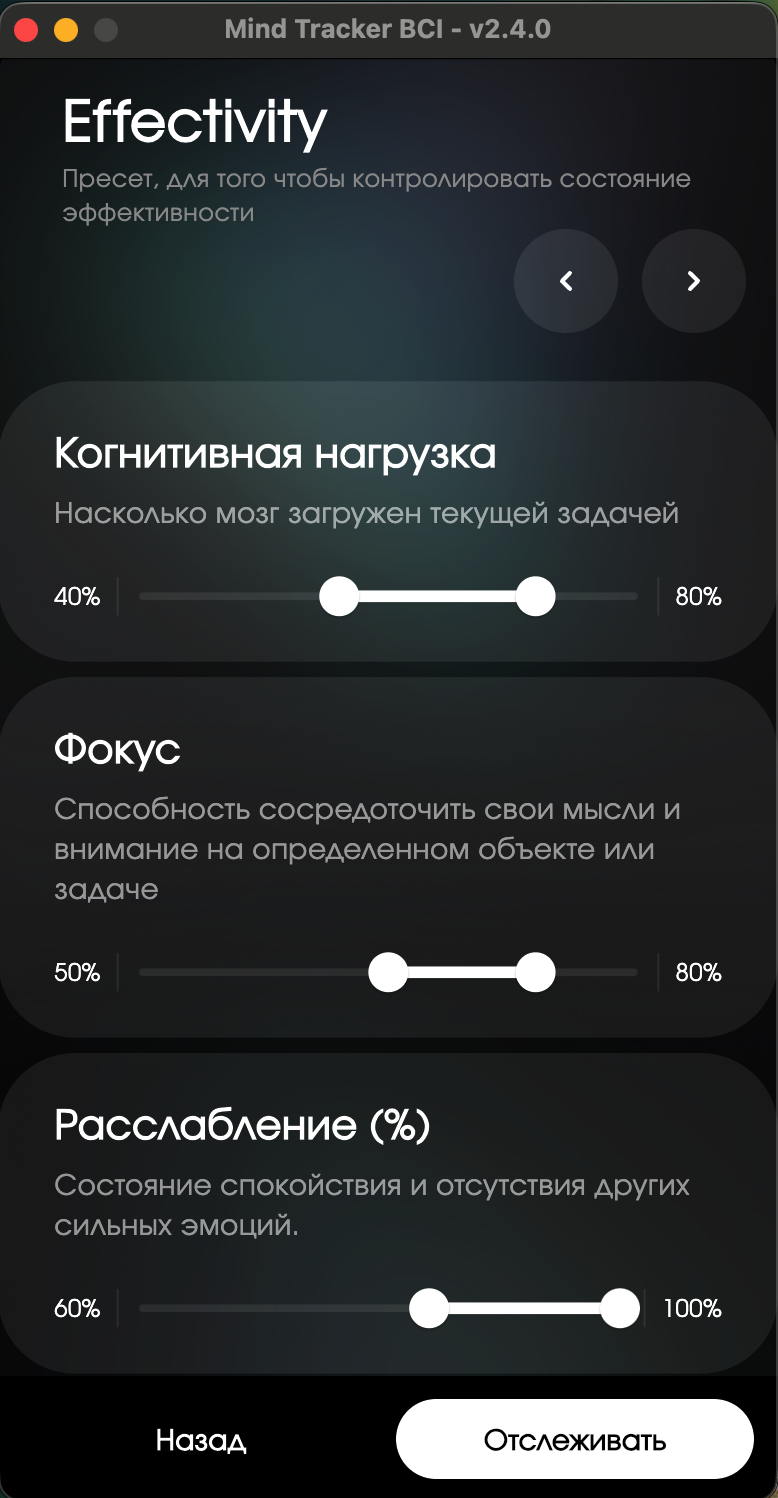
Effectivity preset: metrics sliders with thresholds
| Metrics | Lower threshold | Upper threshold | What does it mean |
|---|---|---|---|
| Cognitive load | 40% | 80% | Below 40% - the brain is underutilized; above 80% - overload |
| Focus | 50% | 80% | Optimal concentration zone |
| Relaxation | 60% | 100% | Level of peace and absence of stress |
Creating your own preset
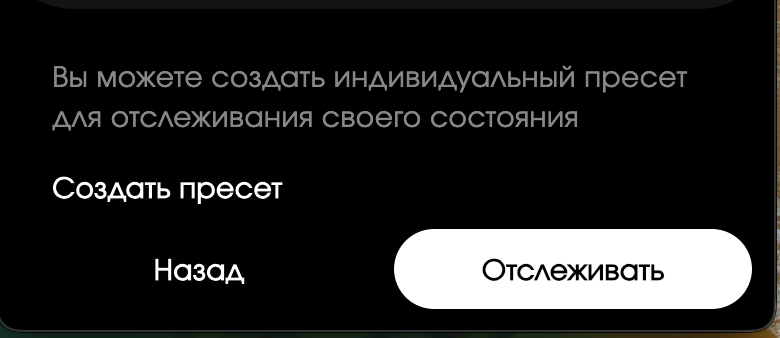
“Create preset” button
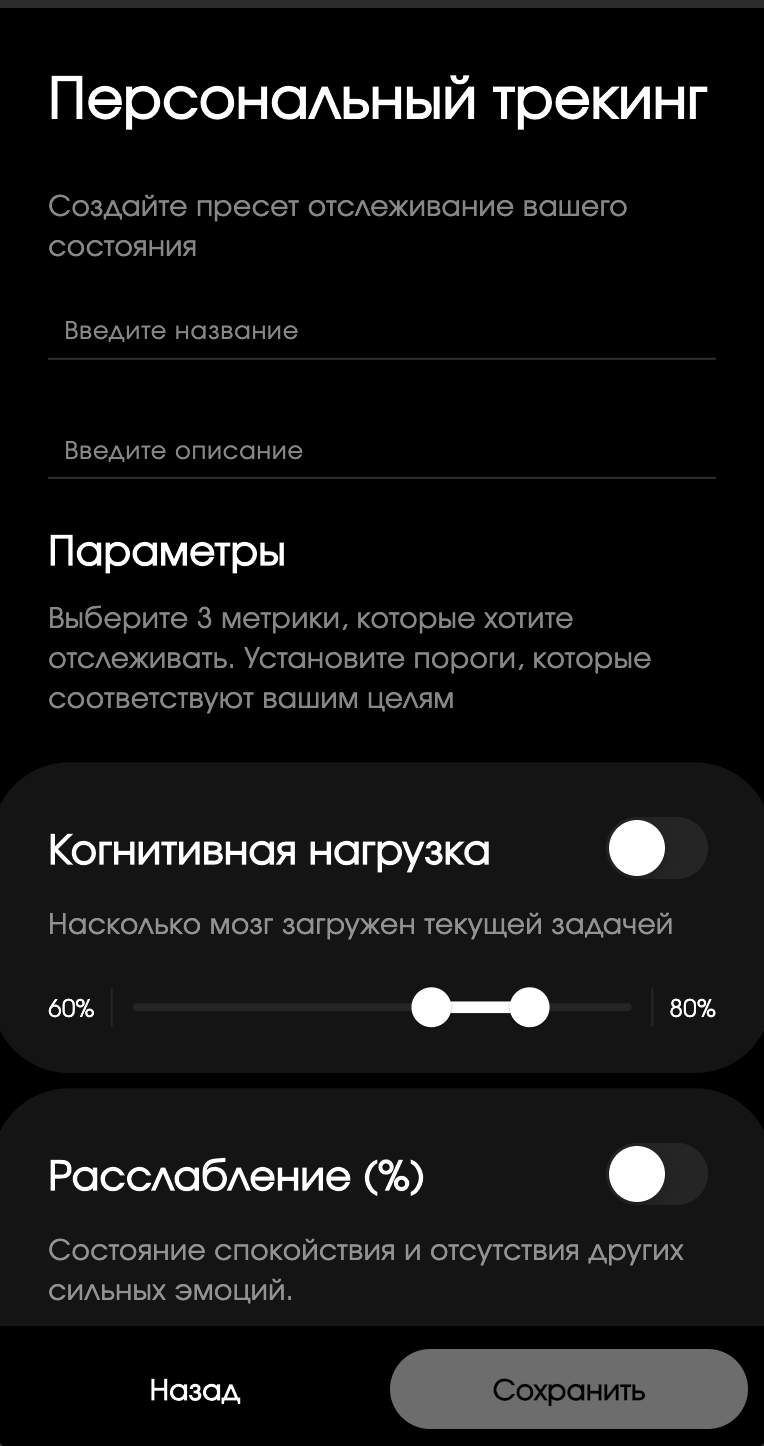
Form: title, description, choice of 3 metrics
All available metrics for presets
When creating a preset, available 11 metrics, each with a customizable range:
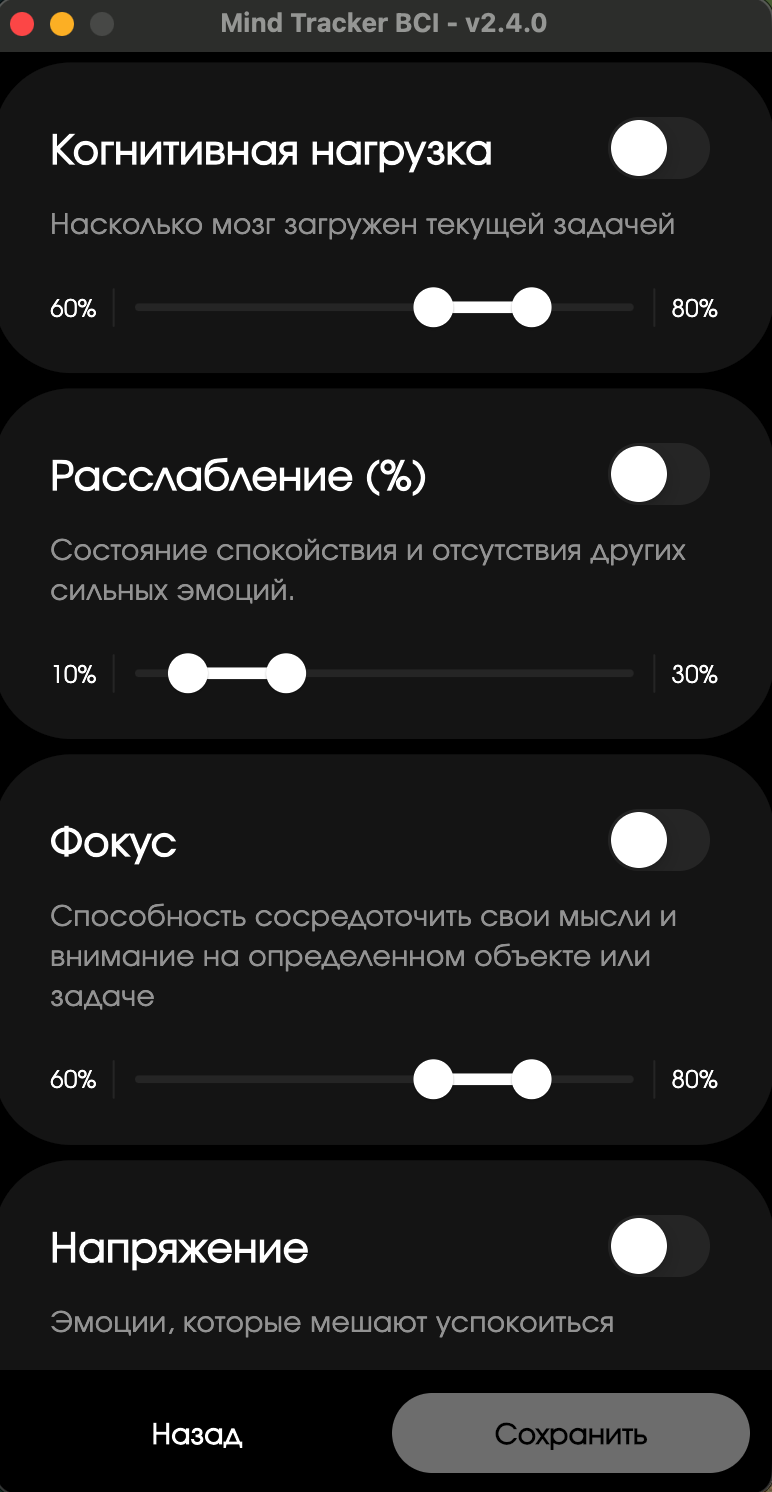
Cognitive load, Relaxation, Focus, Tension
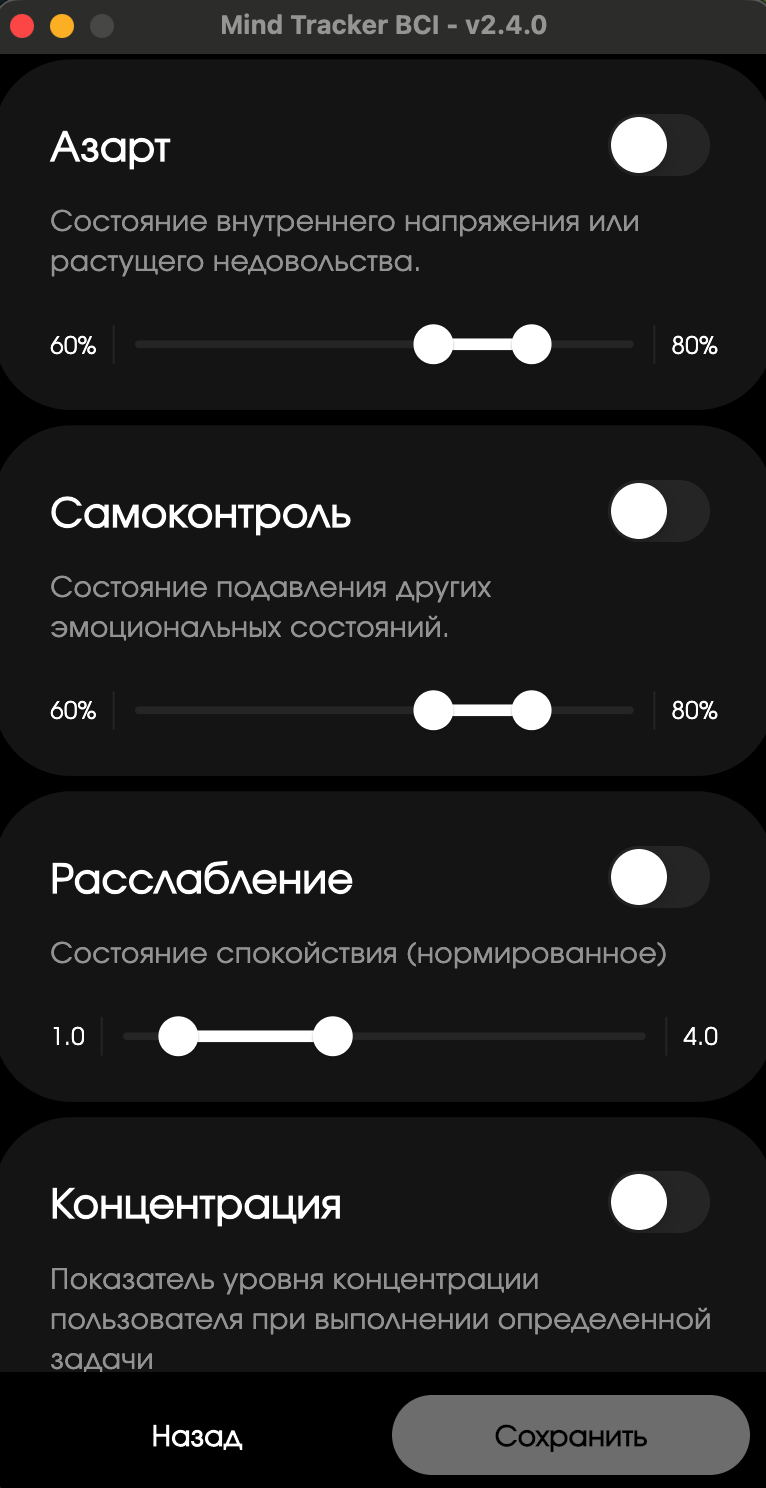
Excitement, Self-control, Relaxation (normal), Concentration
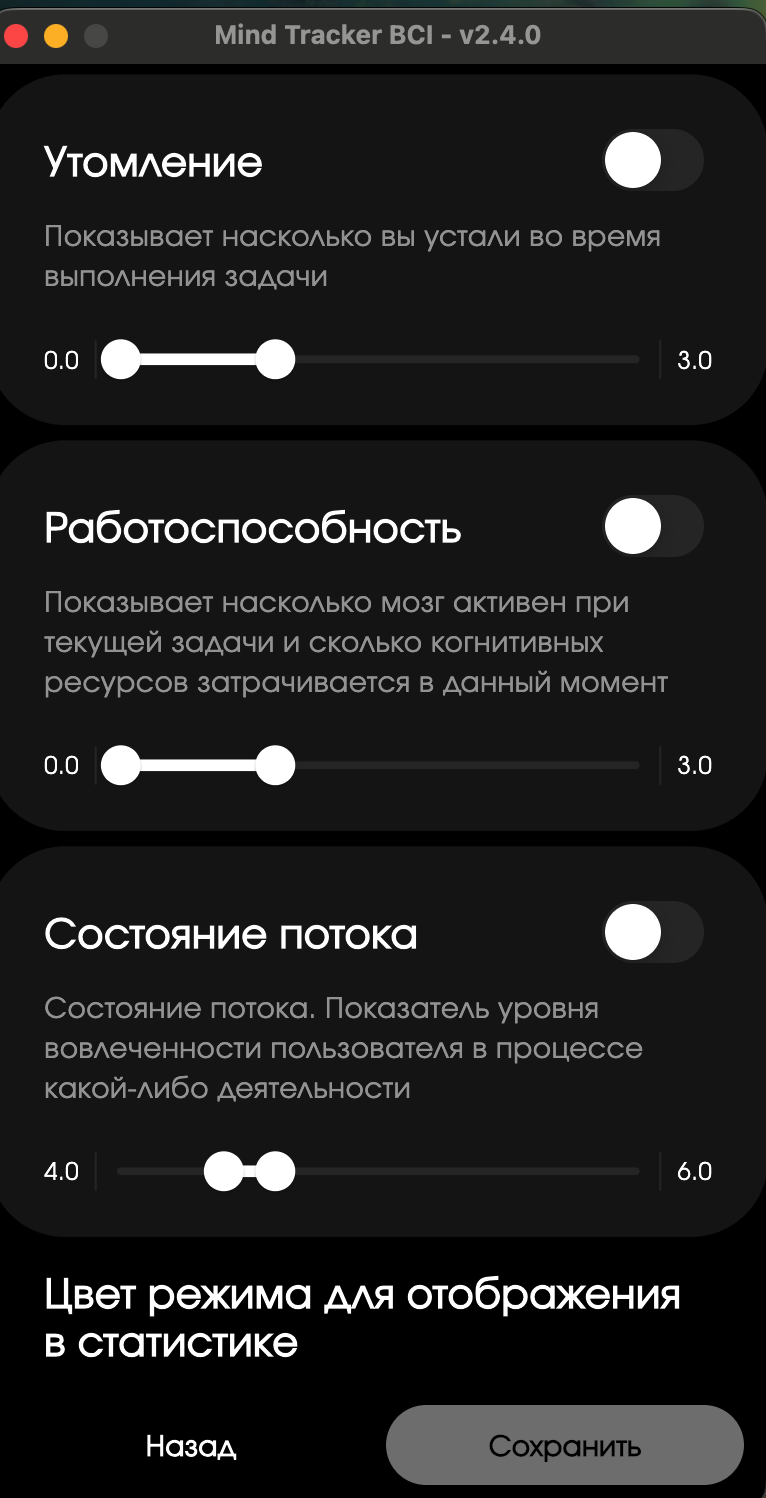
Fatigue, Performance, Flow State + Color Choice
Full table of metrics with recommended values
| # | Metrics | Scale | Recommended min. | Recommended max. | Description |
|---|---|---|---|---|---|
| 1 | Cognitive load | 0–100% | 40% | 80% | Brain overload with task |
| 2 | Relaxation (%) | 0–100% | 0% | 30% | Calmness without strong emotions |
| 3 | Focus | 0–100% | 50% | 80% | Focus on the task |
| 4 | Voltage | 0–100% | 60% | 80% | Emotions that prevent you from relaxing |
| 5 | Excitement | 0–100% | 60% | 80% | Internal excitement |
| 6 | Self-control | 0–100% | 60% | 80% | Suppressing distractions |
| 7 | Relaxation (normal) | 1.0–4.0 | 1.0 | 4.0 | Standardized units |
| 8 | Concentration | — | — | — | Level when completing a task |
| 9 | Fatigue | 0.0–3.0 | 0.0 | 3.0 | Fatigue during a task |
| 10 | Performance | 0.0–3.0 | 0.0 | 3.0 | Consumption of cognitive resources |
| 11 | Thread State | 4.0–6.0 | 4.0 | 6.0 | Involvement in activities |
Recommended combinations for tracking
💼 Preset «Working day» (Effectivity)
| Metrics | Minimum | Maximum |
|---|---|---|
| Cognitive load | 40% | 80% |
| Focus | 50% | 80% |
| Relaxation (%) | 60% | 100% |
Universal preset for office work. Signal if overloaded or out of focus.
🔥 Preset «Deep work»
| Metrics | Minimum | Maximum |
|---|---|---|
| Cognitive load | 60% | 80% |
| Focus | 60% | 80% |
| Self-control | 60% | 80% |
For programming, analytics, writing texts. High thresholds - the brain is completely in the task.
🧸 Preset «Antistress / Recovery»
| Metrics | Minimum | Maximum |
|---|---|---|
| Relaxation (%) | 60% | 100% |
| Voltage | 0% | 30% |
| Fatigue | 0.0 | 1.0 |
For breaks and evening sessions. Maximum relaxation, minimum tension.
✨ Preset «Thread State»
| Metrics | Minimum | Maximum |
|---|---|---|
| Thread State | 4.0 | 6.0 |
| Performance | 1.5 | 3.0 |
| Focus | 50% | 80% |
To search and hold "flow". When all three are in the green zone, you are in the flow.
📚 Preset “Education and Memorization”
| Metrics | Minimum | Maximum |
|---|---|---|
| Concentration | 50% | 80% |
| Cognitive load | 40% | 70% |
| Relaxation (%) | 30% | 60% |
For studying, courses, reading. Moderate load + concentration.
Audio feedback
When tracking, you can configure sound signals that are triggered when thresholds are exceeded:
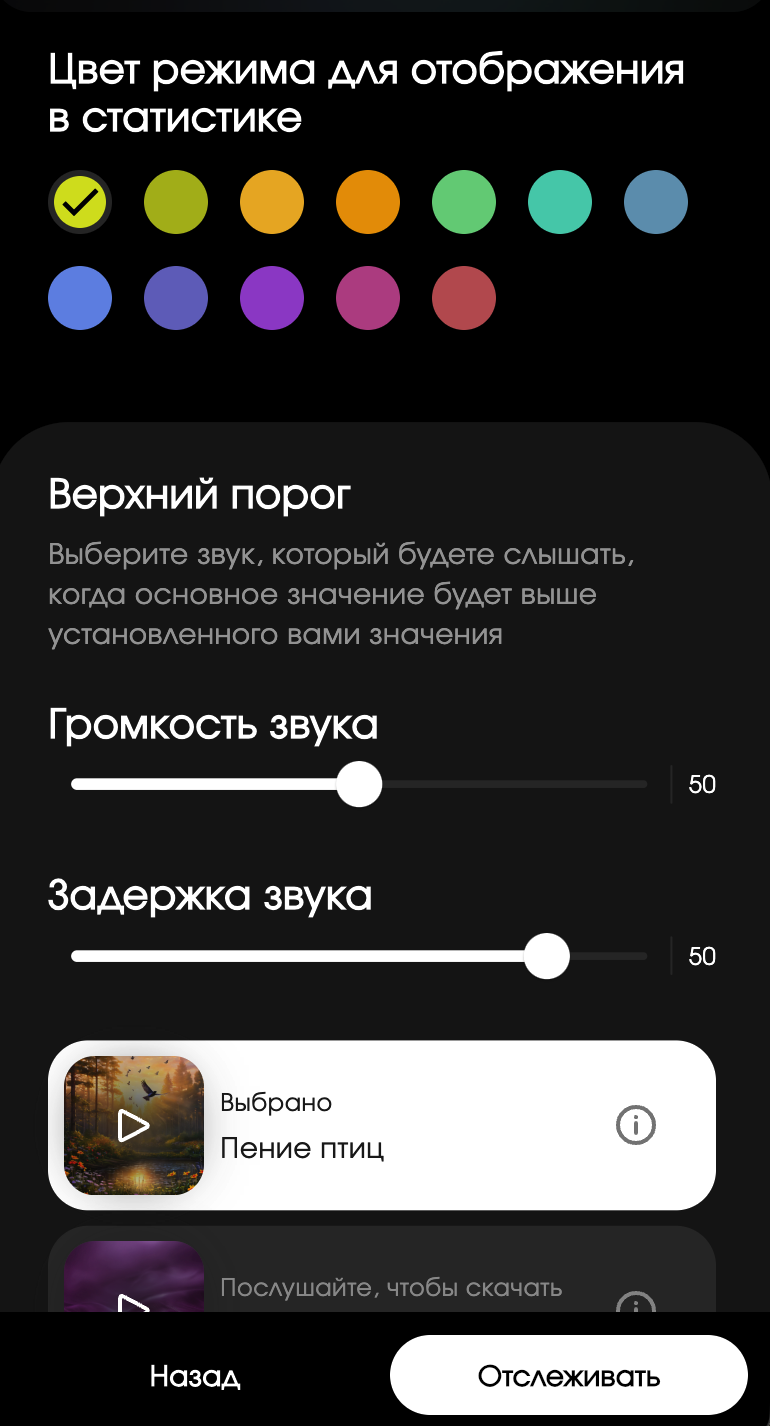
Upper threshold: sound, volume, delay
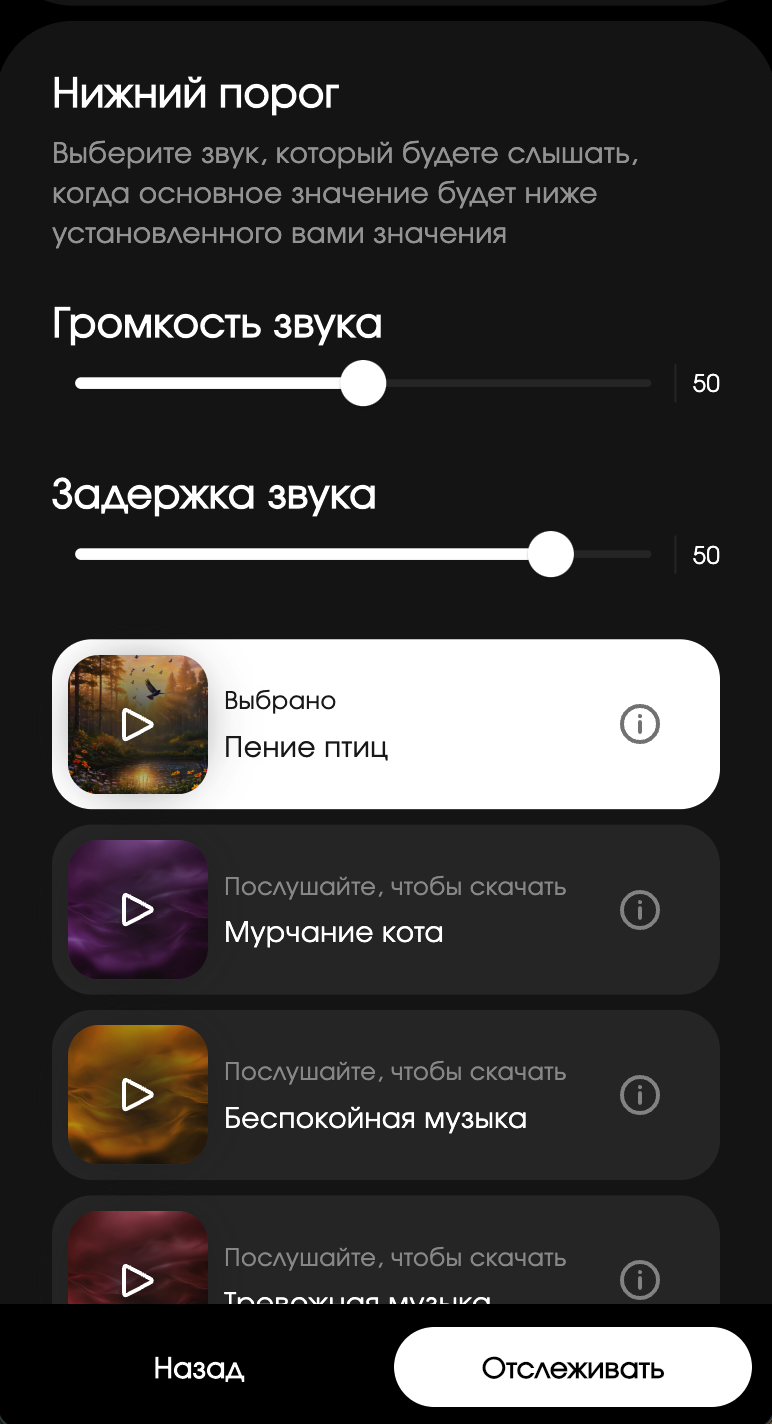
Lower threshold: Birds singing, Cat purring, Disturbing music, etc.
Sound logic:
- Upper threshold — triggers when the indicator higher set value (overload)
- Lower threshold — triggers when the indicator below norms (loss of focus)
- Volume and delay can be adjusted separately for each threshold
Fatigue and rest mode
The app tracks accumulated fatigue and signals when it's time to rest.
Setting Fatigue Thresholds
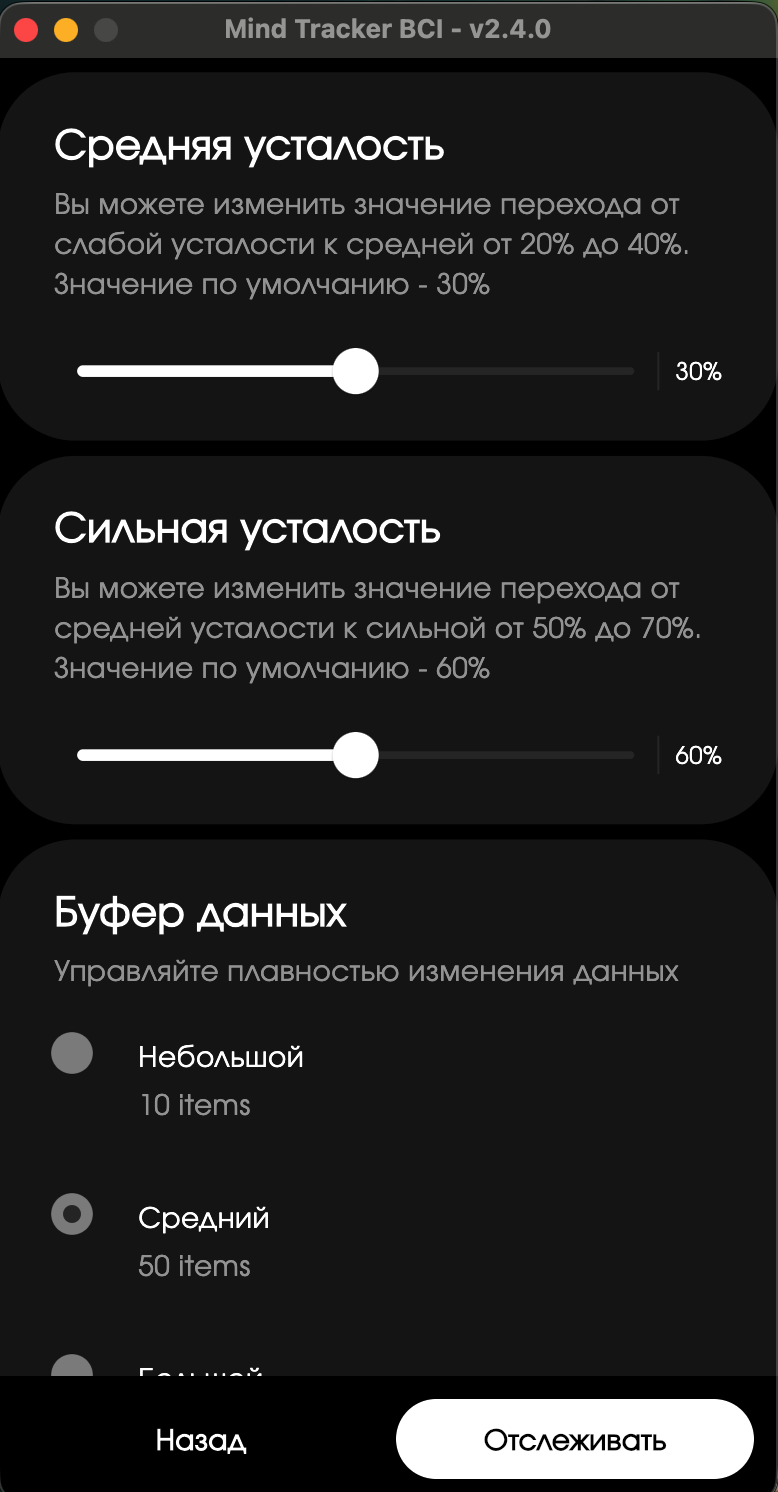
Moderate fatigue: 30%, Severe fatigue: 60%, Data buffer
| Parameter | Default | Description |
|---|---|---|
| Average fatigue | 30% | Transition from “weak” to “medium” |
| Extreme fatigue | 60% | Transition from "medium" to "strong" |
| Data Buffer | 10 Items | Smoothness of changes in indicators |
What does fatigue look like while trekking?
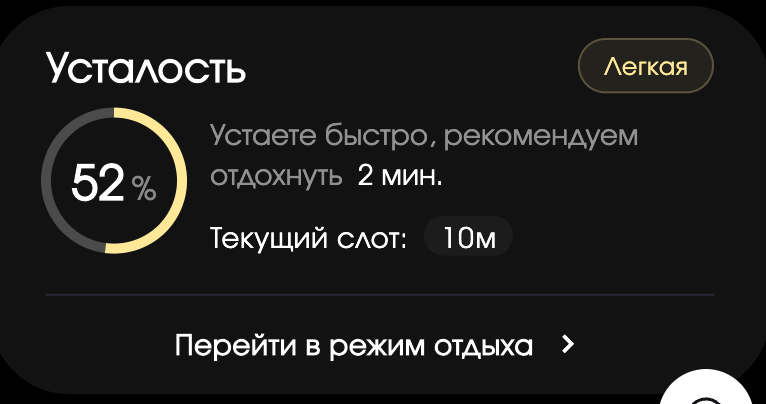
52% (Easy) - recommendation to rest for 2 minutes, current slot 10 minutes
Rest mode
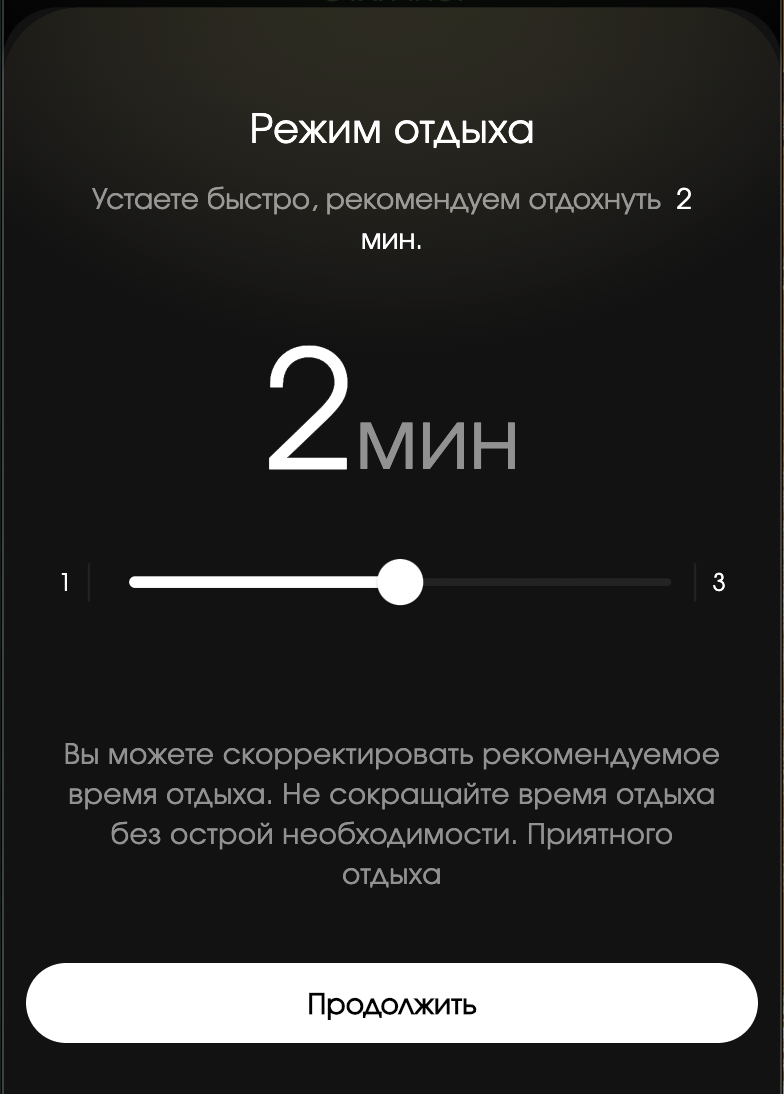
Select duration (1–3 min)
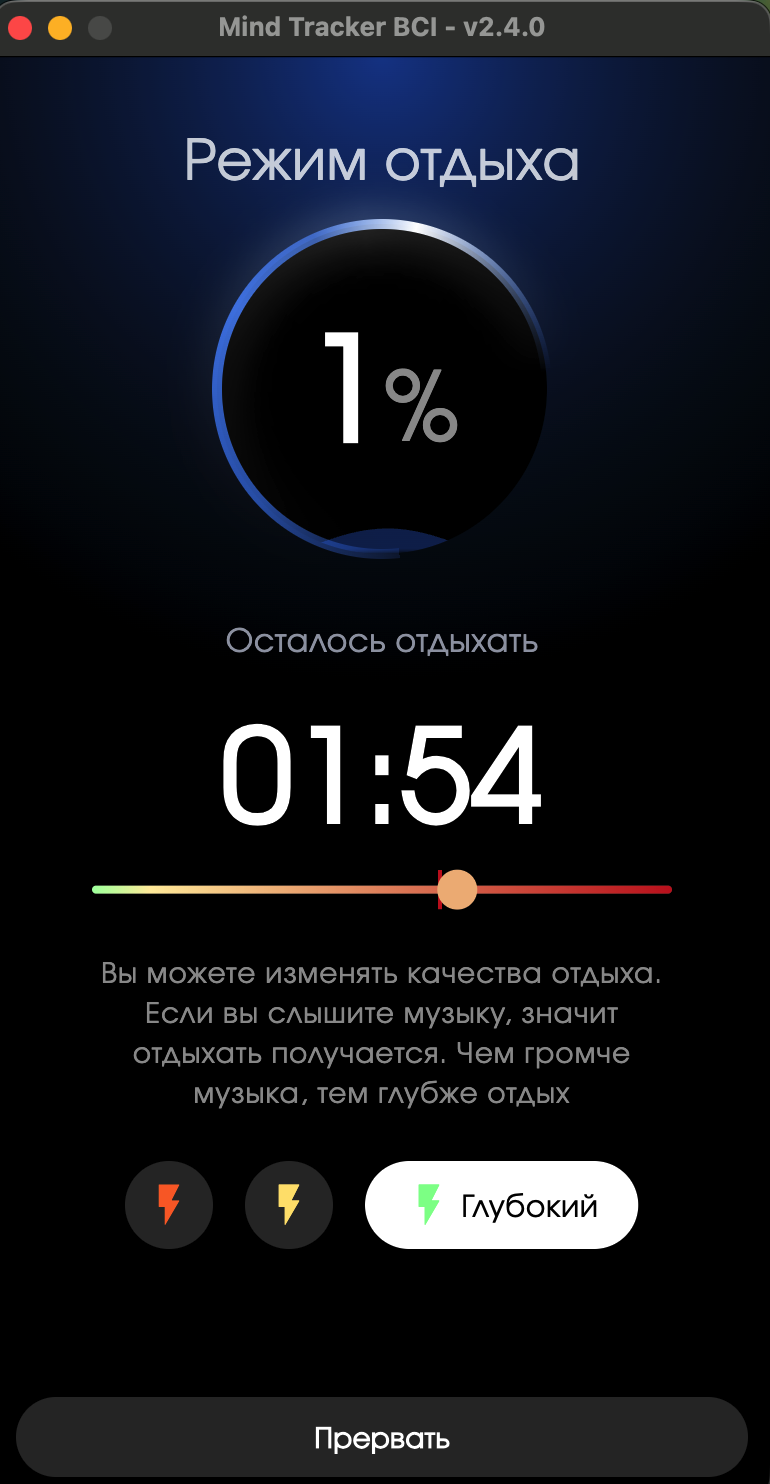
Countdown timer. Deep rest = loud music
Rest Mode Settings
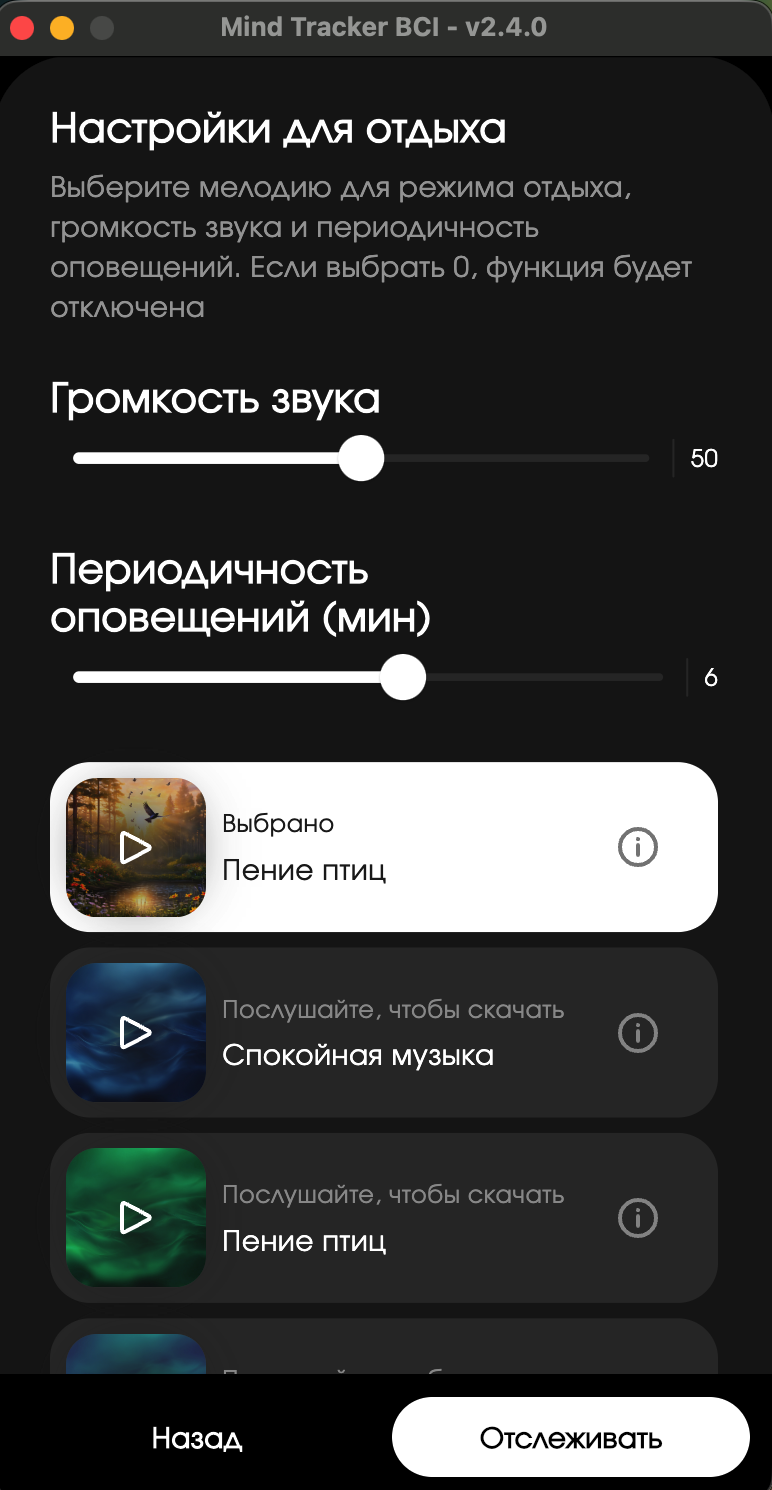
Melody, volume, frequency of notifications. If 0 - the function is disabled
Working day slots
The application automatically divides the working time into slots - periods between breaks:
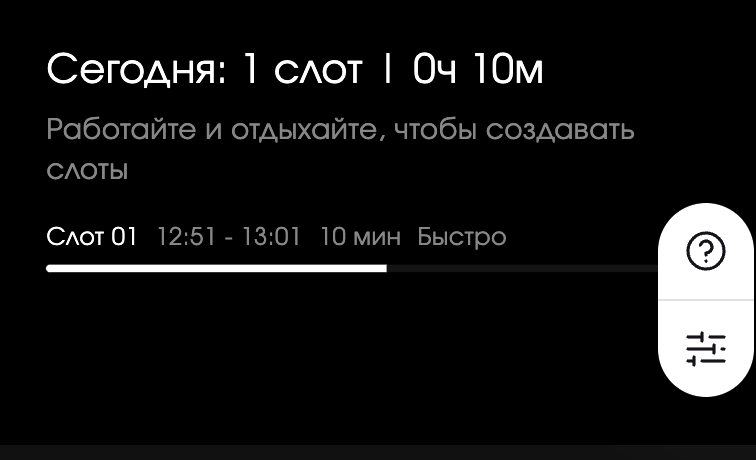
1 slot per day (0h 10m). Slot 01: 12:51–13:01, 10 min, fatigue rate "Fast"
What slots give:
- See how long you can work until you get tired
- Determine your peak productivity hours
- Monitor whether breaks help you recover
- Create an individual work rhythm
Trainings (feedback neurofeedback)
Section with training to control the state of the brain through biofeedback:
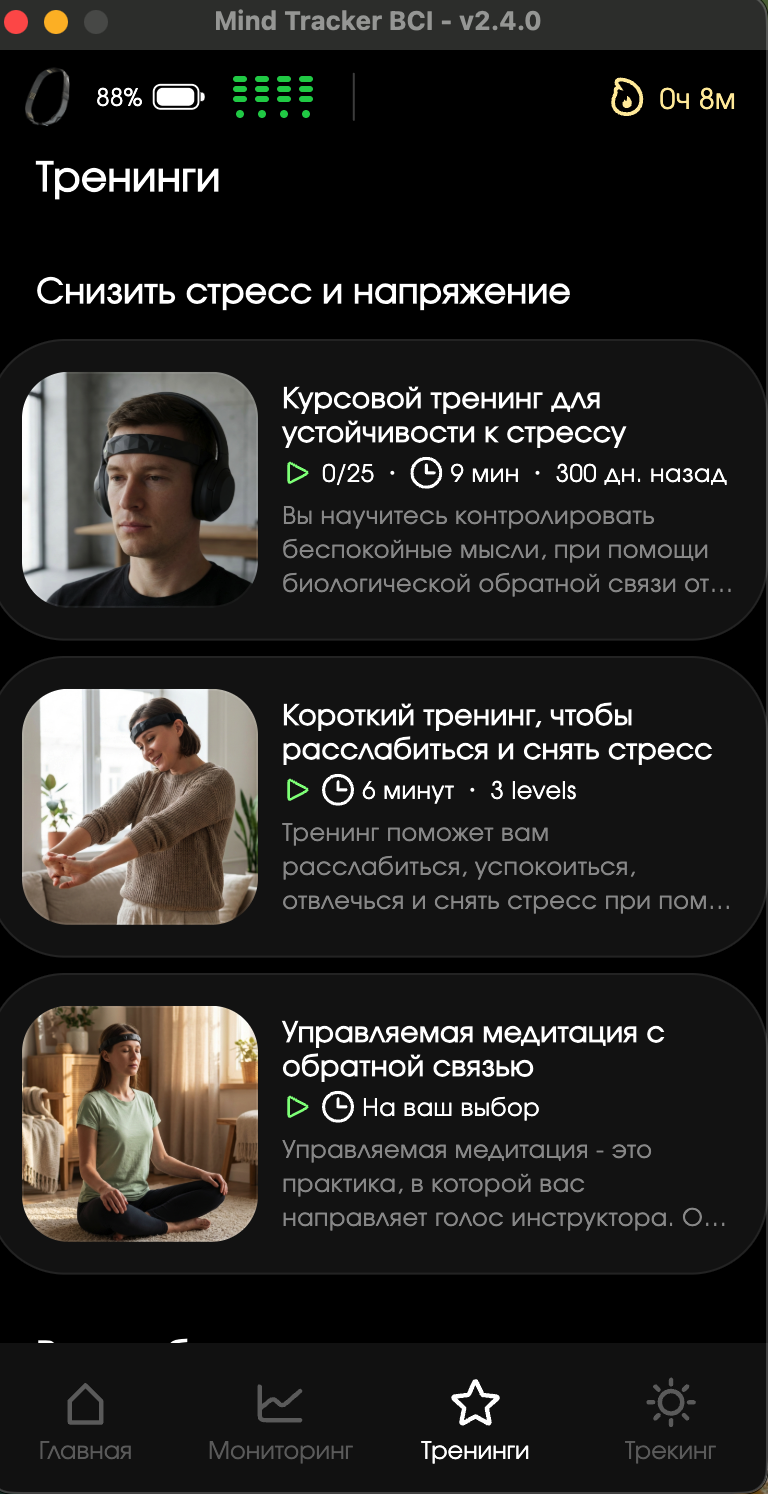
Course training (25x9 min), Short training (6 min), Guided meditation
| Training | Duration | For whom/when |
|---|---|---|
| Stress resistance course training | 25 sessions x 9 min | Systematic work with stress. Results in 2–4 weeks |
| Short relaxation training | 6 min, 3 levels | Quick stress relief between tasks |
| Guided Meditation | Your choice | Voice instructor + objective depth assessment |
Quick start
What to do after purchasing a Neiry device:
Connection
Download Mind Tracker BCIfrom App Store / Google Play. Put the device on (electrodes to the skin), turn it on (green indicator). In the application: Bluetooth → Search → Connect. Wait for 4 green indicators.
Calibration
Sit quietly, close your eyes for 30 seconds. The application will determine your iAF and show your psychotype.
First monitoring
Go to the tab Monitoring. Watch 3 graphs. Try to relax - the graph will go up. Focus - the focus graph will rise.
First training
Go to Trainings. Start with the “Short Relaxation Training” (6 min). Follow the audio prompts.
Tracking setup
Go to Tracking, select preset Effectivity. Work - the application will monitor your condition and tell you when to rest.
Cheat sheet: all combinations on one page
Monitoring - which 3 graphics to choose
| Task | Metric 1 | Metrica 2 | Metrica 3 |
|---|---|---|---|
| Regular work | Cognitive load | Focus | Relaxation |
| Antistress | Relaxation | Voltage | Self-control |
| Creation | Focus | Relaxation | Excitement |
| Deep Work | Cognitive load | Focus | Self-control |
| Recovery | Relaxation | Voltage | Cognitive load |
Tracking - average thresholds for presets
| Preset | Metric 1 (min-max) | Metric 2 (min-max) | Metric 3 (min-max) |
|---|---|---|---|
| Working day | Load 40–80% | Focus 50–80% | Relaxation 60–100% |
| Deep work | Load 60–80% | Focus 60–80% | Self-control 60–80% |
| Antistress | Relaxation 60–100% | Voltage 0–30% | Fatigue 0–1.0 |
| Thread State | Stream 4.0–6.0 | Performance 1.5–3.0 | Focus 50–80% |
| Education | Concentration 50–80% | Load 40–70% | Relaxation 30–60% |