What is it and why
Neiry Band is a wearable neural interface. Simply put, it’s a headband that reads your brain’s electrical activity (EEG) and cardiovascular indicators (pulse, heart rate variability).
Neiry Capsule is a program on a computer that receives data from the tracker, processes it and shows you in real time: how concentrated, relaxed, tired, stressed, or in a state of flow you are.
Why is this in the context of ONTO NOTHING: we use Neiry as a practice verification tool. When you stop your internal dialogue, your brain changes its activity. Neiry Capsule records these changes objectively, in numbers. This is not about “I believe / I don’t believe” - it’s about data.
What's included - unboxing
When you receive a Neiry tracker, the package usually includes:
- The tracker itself (headband) — soft bandage with electrodes and electronic module
- Charging cable (micro-USB or USB-C - depends on the model)
- USB Bluetooth adapter — in case your computer does not have built-in Bluetooth
- Instructions (short, from the manufacturer)
What to check when unpacking:
- The tracker is not damaged, the electrodes are in place (four dry electrodes on the inside)
- The charging cable fits into the connector on the tracker
- The tracker is charging (when connected to charging, the indicator should light up)
Physical Design - Inspection, Weaknesses, Precautions
Tracker elements
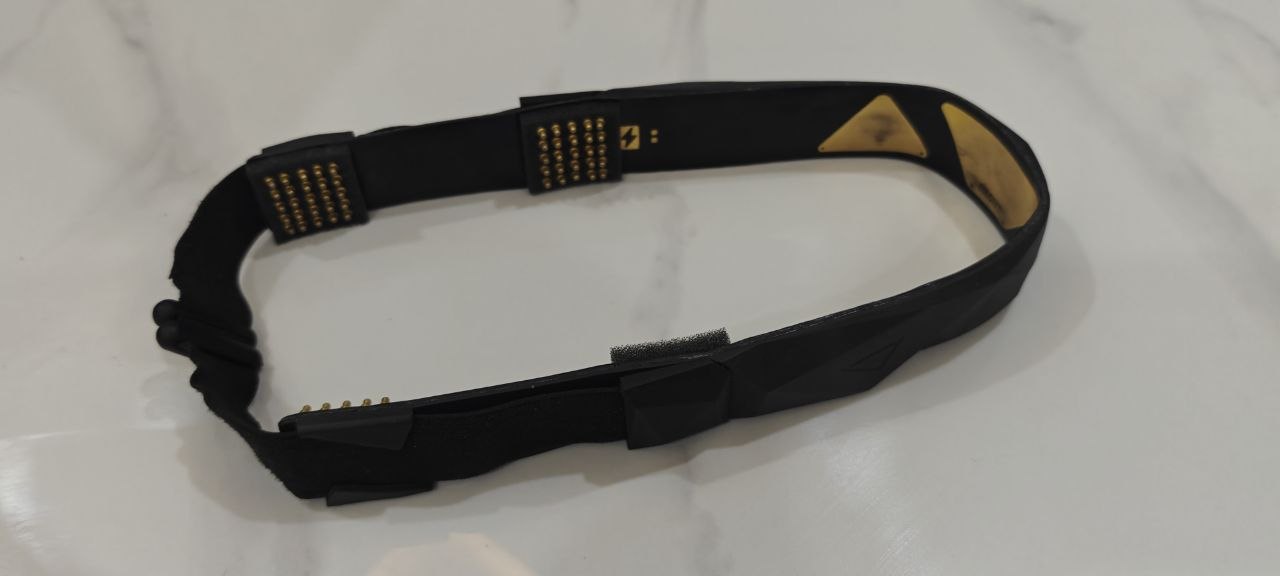
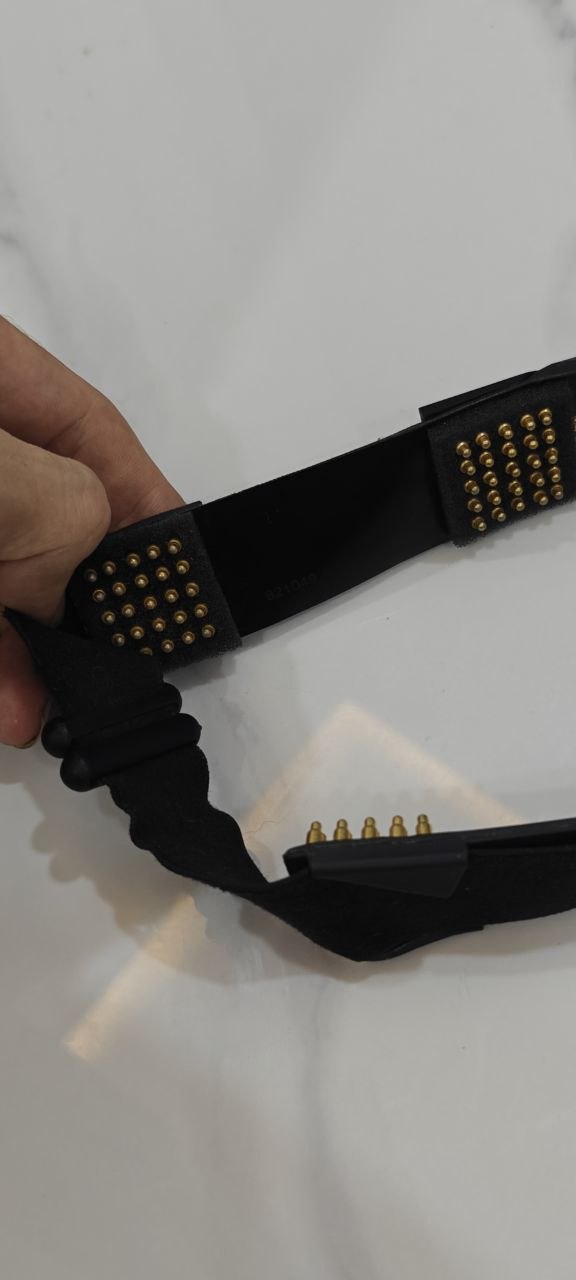
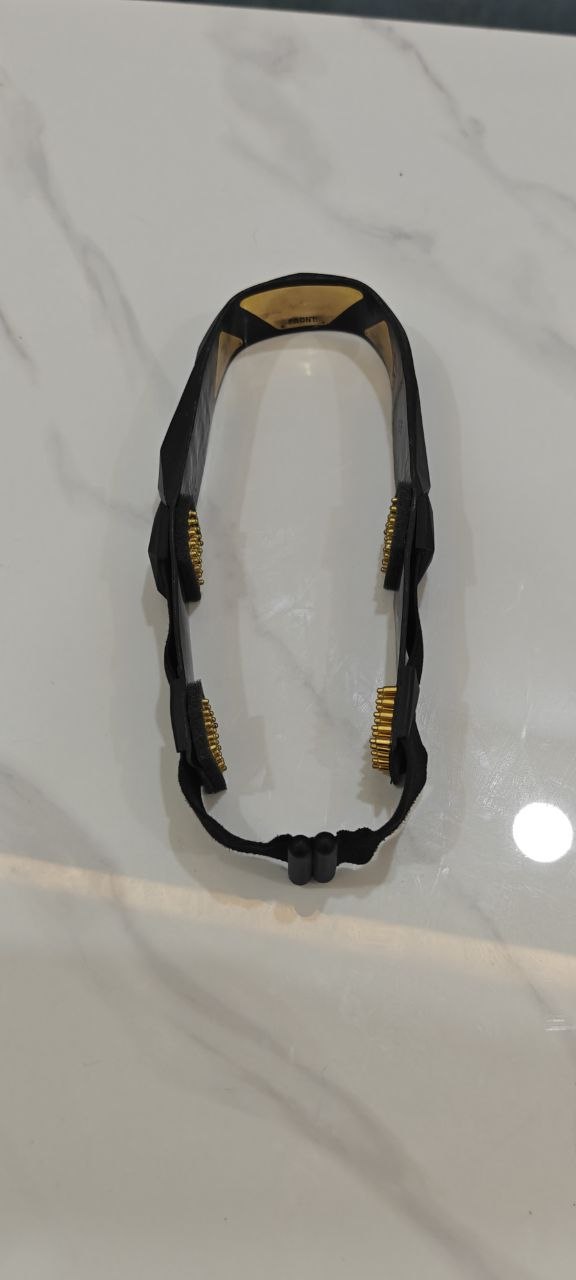
- Electrodes (4 pieces): located on the inside of the bandage. They read the EEG signal. Designations: O1, O2 (occipital region), T3, T4 (temporal region). These are dry electrodes - no gel is needed.
- PPG sensor: optical heart rate sensor (golden triangular elements). Shines light into the skin and measures changes in blood flow.
- Power button: one physical button on the clasp. You turn it on, off and put it into pairing mode.
- Indicator (LED): Indicates the device status through flashing frequency.
- Serial number: is on central module from the inside of the tracker. This is a 6-digit numeric code (for example, 821049). You will need it to obtain an activation key.. Record or photograph it now.
Weaknesses - what to pay attention to
- Electrodes - do not scratch or rub them with abrasive materials. If plaque accumulates on them (sebum, sweat), wipe with a soft cloth slightly moistened with alcohol or an antiseptic.. Dirty electrodes = poor contact = incorrect data.
- PPG sensor — the optical window must be clean. Do not cover it with stickers or touch the lens with your fingers.
- Charging cable - do not charge the tracker while in use. Charge first, use later.
- Bluetooth module — the tracker communicates with the computer only via Bluetooth. Range is limited (~5-10 meters). Do not go far from the computer while taking measurements.
- Bandage - do not overstretch. The tissue may stretch over time, causing the electrodes to weaken in contact with the skin.
Precautions from Konstantin Shel
- Do not use the tracker with wet hair - After showering, wait until your hair is dry. Moisture changes conductivity and distorts data.
- Remove the tracker if you experience headaches, dizziness or any discomfort. The tracker is a passive device and does not emit anything to the brain, but the physical pressure of the bandage may increase discomfort.
- Store the tracker in a dry place, do not leave in the sun. Electronics do not like heat and moisture.
- Charge the tracker before taking measurements. If the battery charge is below 15%, the quality of data transfer may decrease. The program shows the charge level (Battery) after connection.
- Do not touch the electrodes and PPG sensor with your hands immediately before taking measurements. — fat from the fingers worsens contact.
Downloading the Capsule program
The Neiry Capsule program is distributed through the official Telegram channel.
Step by step:
- Open a Telegram channel Neiry Capsule: t.me/neurocapsule
- Scroll through the channel and find last post with download link programs
- Be sure to read the entire post before downloading — there may be important notes on the current version, known bugs, update instructions
- Download the archive from the link in the post
Installing the program
What's inside the archive
After downloading and unpacking the archive, you will see two folders:
| Folder | For whom | What's inside |
|---|---|---|
| CapsuleAPI | For developers | API for integration - you DO NOT need it |
| CapsuleAppReleases | COME HERE | Main Capsule program |
Platform selection
Open the folder CapsuleAppReleases. Inside are folders for different operating systems:
- Windows - for Windows 10/11
- macOS - for Mac with Intel processor
- ARM - for Mac with Apple Silicon processor (M1, M2, M3, M4)
How to find out what Mac you have: Click the Apple icon in the top left corner of the screen → About This Mac. If the “Chip” line says “Apple M1/M2/M3/M4” - select the folder ARM. If it says "Processor: Intel" - select macOS.
Launch
- Windows: open the Windows folder, find the .exe file, run it.
- Mac: open the appropriate folder, find the application file (.app). When you launch it for the first time, macOS may block it - see. chapter Typical problems.
Bluetooth is a must
The program communicates with the tracker only via Bluetooth. Make sure that:
- Bluetooth is enabled on your computer
- If there is no built-in Bluetooth (often happens on desktop PCs), insert USB Bluetooth adapter from the kit
Obtaining an activation key
For the program to work you need license key. It is linked to the serial number of your tracker and entered once at first start.
How to get the key:
Step 1 - Email the Neiry team:
Send an email to the Neiry team (the address is indicated in the channel) requesting a key. In the letter please indicate:
I request an activation key for Capsule
Mail: [email protected]
Serial number: sn XXXXXX
Where XXXXXX is your 6-digit serial number on the inside of the tracker.
Step 2 - To speed things up: duplicate the request in the channel comments:
- Open a channel t.me/neurocapsule
- Find the latest post with download link
- In comments for this post write the same message (mail + serial number)
This will speed up receiving the key - the guys from Neiry will see your request in two places.
If you have any difficulties, use the Neiry technical support bot:
Write to the bot: t.me/neirybot
Save the key!
After receiving the key save it in a safe place (notes, file, password manager). The key is entered once, but if you reinstall the program, you will need it again.
Turning on and pairing the tracker
Before working in the program, you need to connect the tracker to your computer via Bluetooth. This is done in two stages: first we turn on the tracker and put it into pairing mode, then we find it on the computer.
Step 1 — Turning on the tracker
Press the power button on the tracker to 2 seconds.
How to understand that the tracker is turned on: the indicator starts flashing green, 1 time per second (slow flashing).
Step 2 - Pairing Mode
Without letting go, press the power button again for 4 seconds.
How to understand that the tracker is in pairing mode: the indicator starts flashing fast - 4 times per second (frequent flashing).
Step 3 - Search and connect on your computer
- Open bluetooth settings on your computer:
- Windows: Settings → Bluetooth and devices → Add device
- Mac: System Settings → Bluetooth
- Wait for the device to appear in the list of found devices. headband (or Neiry Headband)
- Click "Connect" / "Pair"
- After successful pairing, the indicator on the tracker will change behavior - the blinking will become more even or the indicator will light up steadily
Step 4 - Connecting in the Capsule program
After pairing through the system, open the Capsule program. The tracker should be detected automatically. You will see:
- IsConnected: true — device is connected
- Battery— charge level (must be >15%)
- Serial — serial number of your device
If the tracker is not detected, see. chapter Typical problems.
How to put on a tracker correctly
Correct fit of the tracker is 80% measurement success. Incorrectly worn tracker = artifacts, noise, incorrect data.
Location
The bandage is put on the head so that:
- Electrodes O1 and O2 - located on back of the head, just above the occipital protuberance (that protruding bone at the back of the head). This area of the visual cortex is the main source of alpha rhythm.
- Electrodes T3 and T4 - located on temples, approximately at the level of the upper edge of the auricle. This is the temporal region.
- PPG sensor - should fit tightly to the skin (usually located next to one of the electrodes).
Providing contact
- Hair: remove hair from under the electrodes. Hair between electrode and skin = insulation = poor signal. If the hair is long, push it apart at the contact points with your fingers, then press the electrode to the skin.
- Clamp: the bandage should fit tight but comfortable. Don't push, but don't hang around either. If the bandage slips, it is too loose.
- Leather: electrodes work better on clean skin. If the skin is very dry, you can lightly wipe the contact areas with a damp cloth (not wet).
Contact quality check
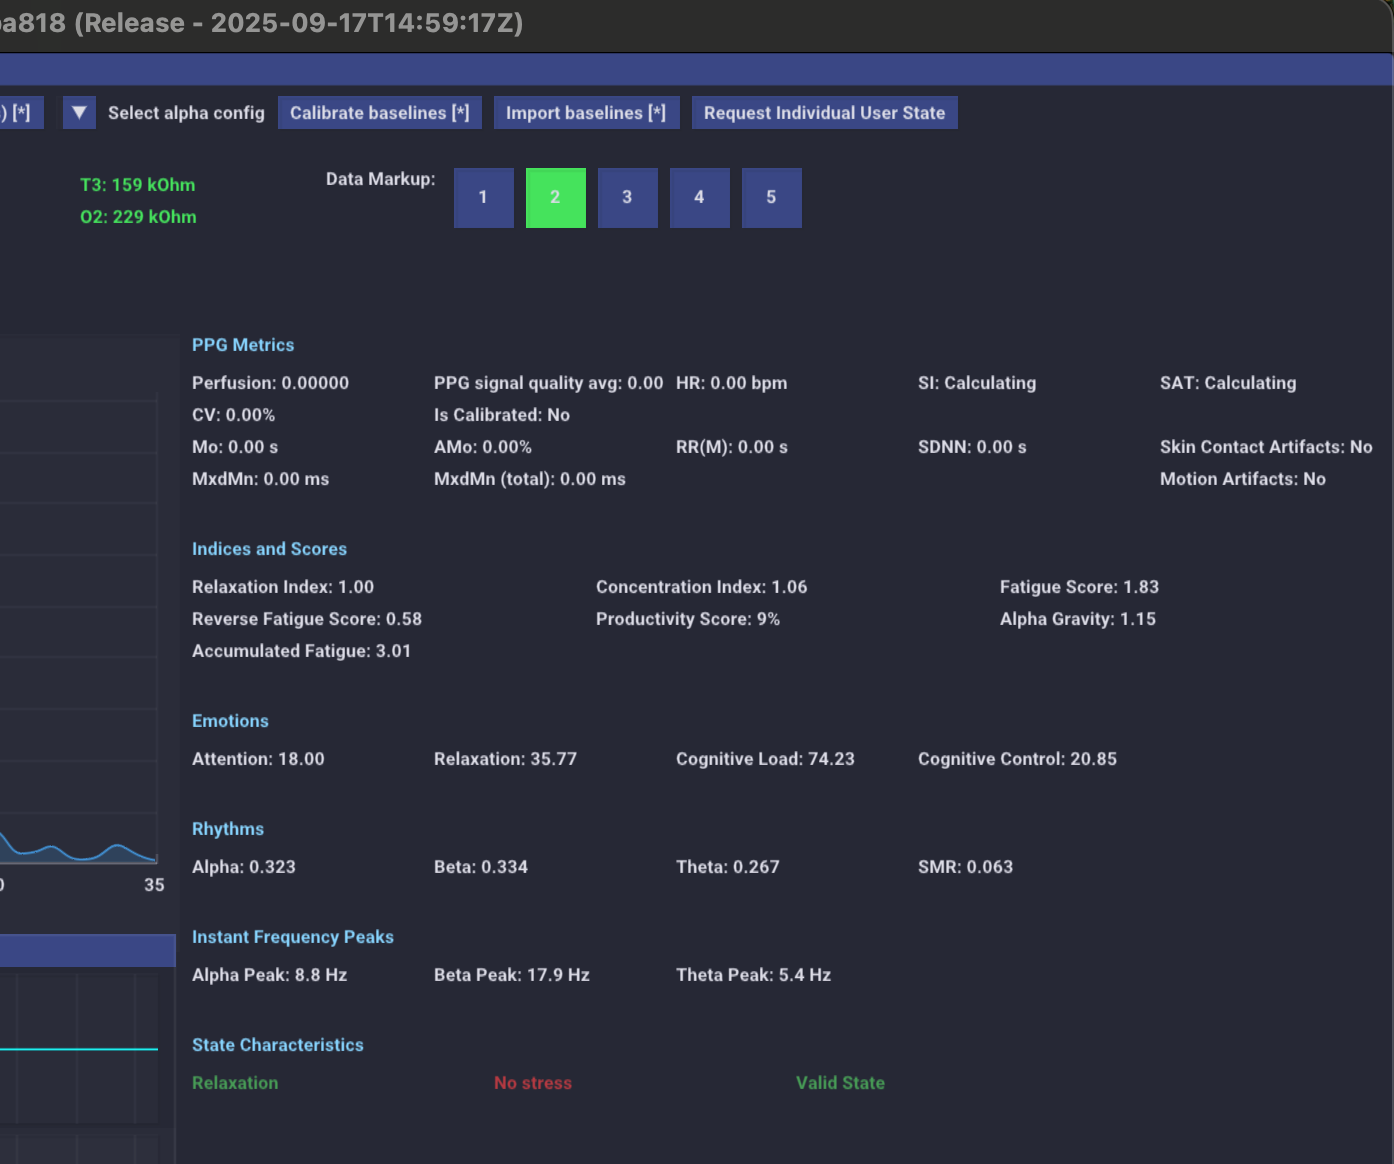
After connecting in the Capsule program you will see the values impedance for each electrode (O1, T3, O2, T4), measured in kOhm:
- Up to 100–300 kOhm - normal contact for dry electrodes
- Above 300 kOhm — the contact is weak, the data may be noisy. Try adjusting the bandage, removing hair, pressing the electrode more tightly.
Also note the field Artifacts:
- No — the signal is clear, everything is fine
- Yes — there is interference in the signal. If the artifacts are constant, check the fit of the tracker
What causes artifacts (interference)
- Head movements
- Facial muscle tension (forehead, jaw)
- Frequent blinking
- Conversation while measuring
- Poor electrode contact
- Electrical appliances nearby (monitors, chargers)
First launch of the program
What do you see on startup?
Don't be alarmed - the program interface looks complicated. There are a lot of graphs, numbers and panels on the screen. This is fine. To get started, you only need a few things.
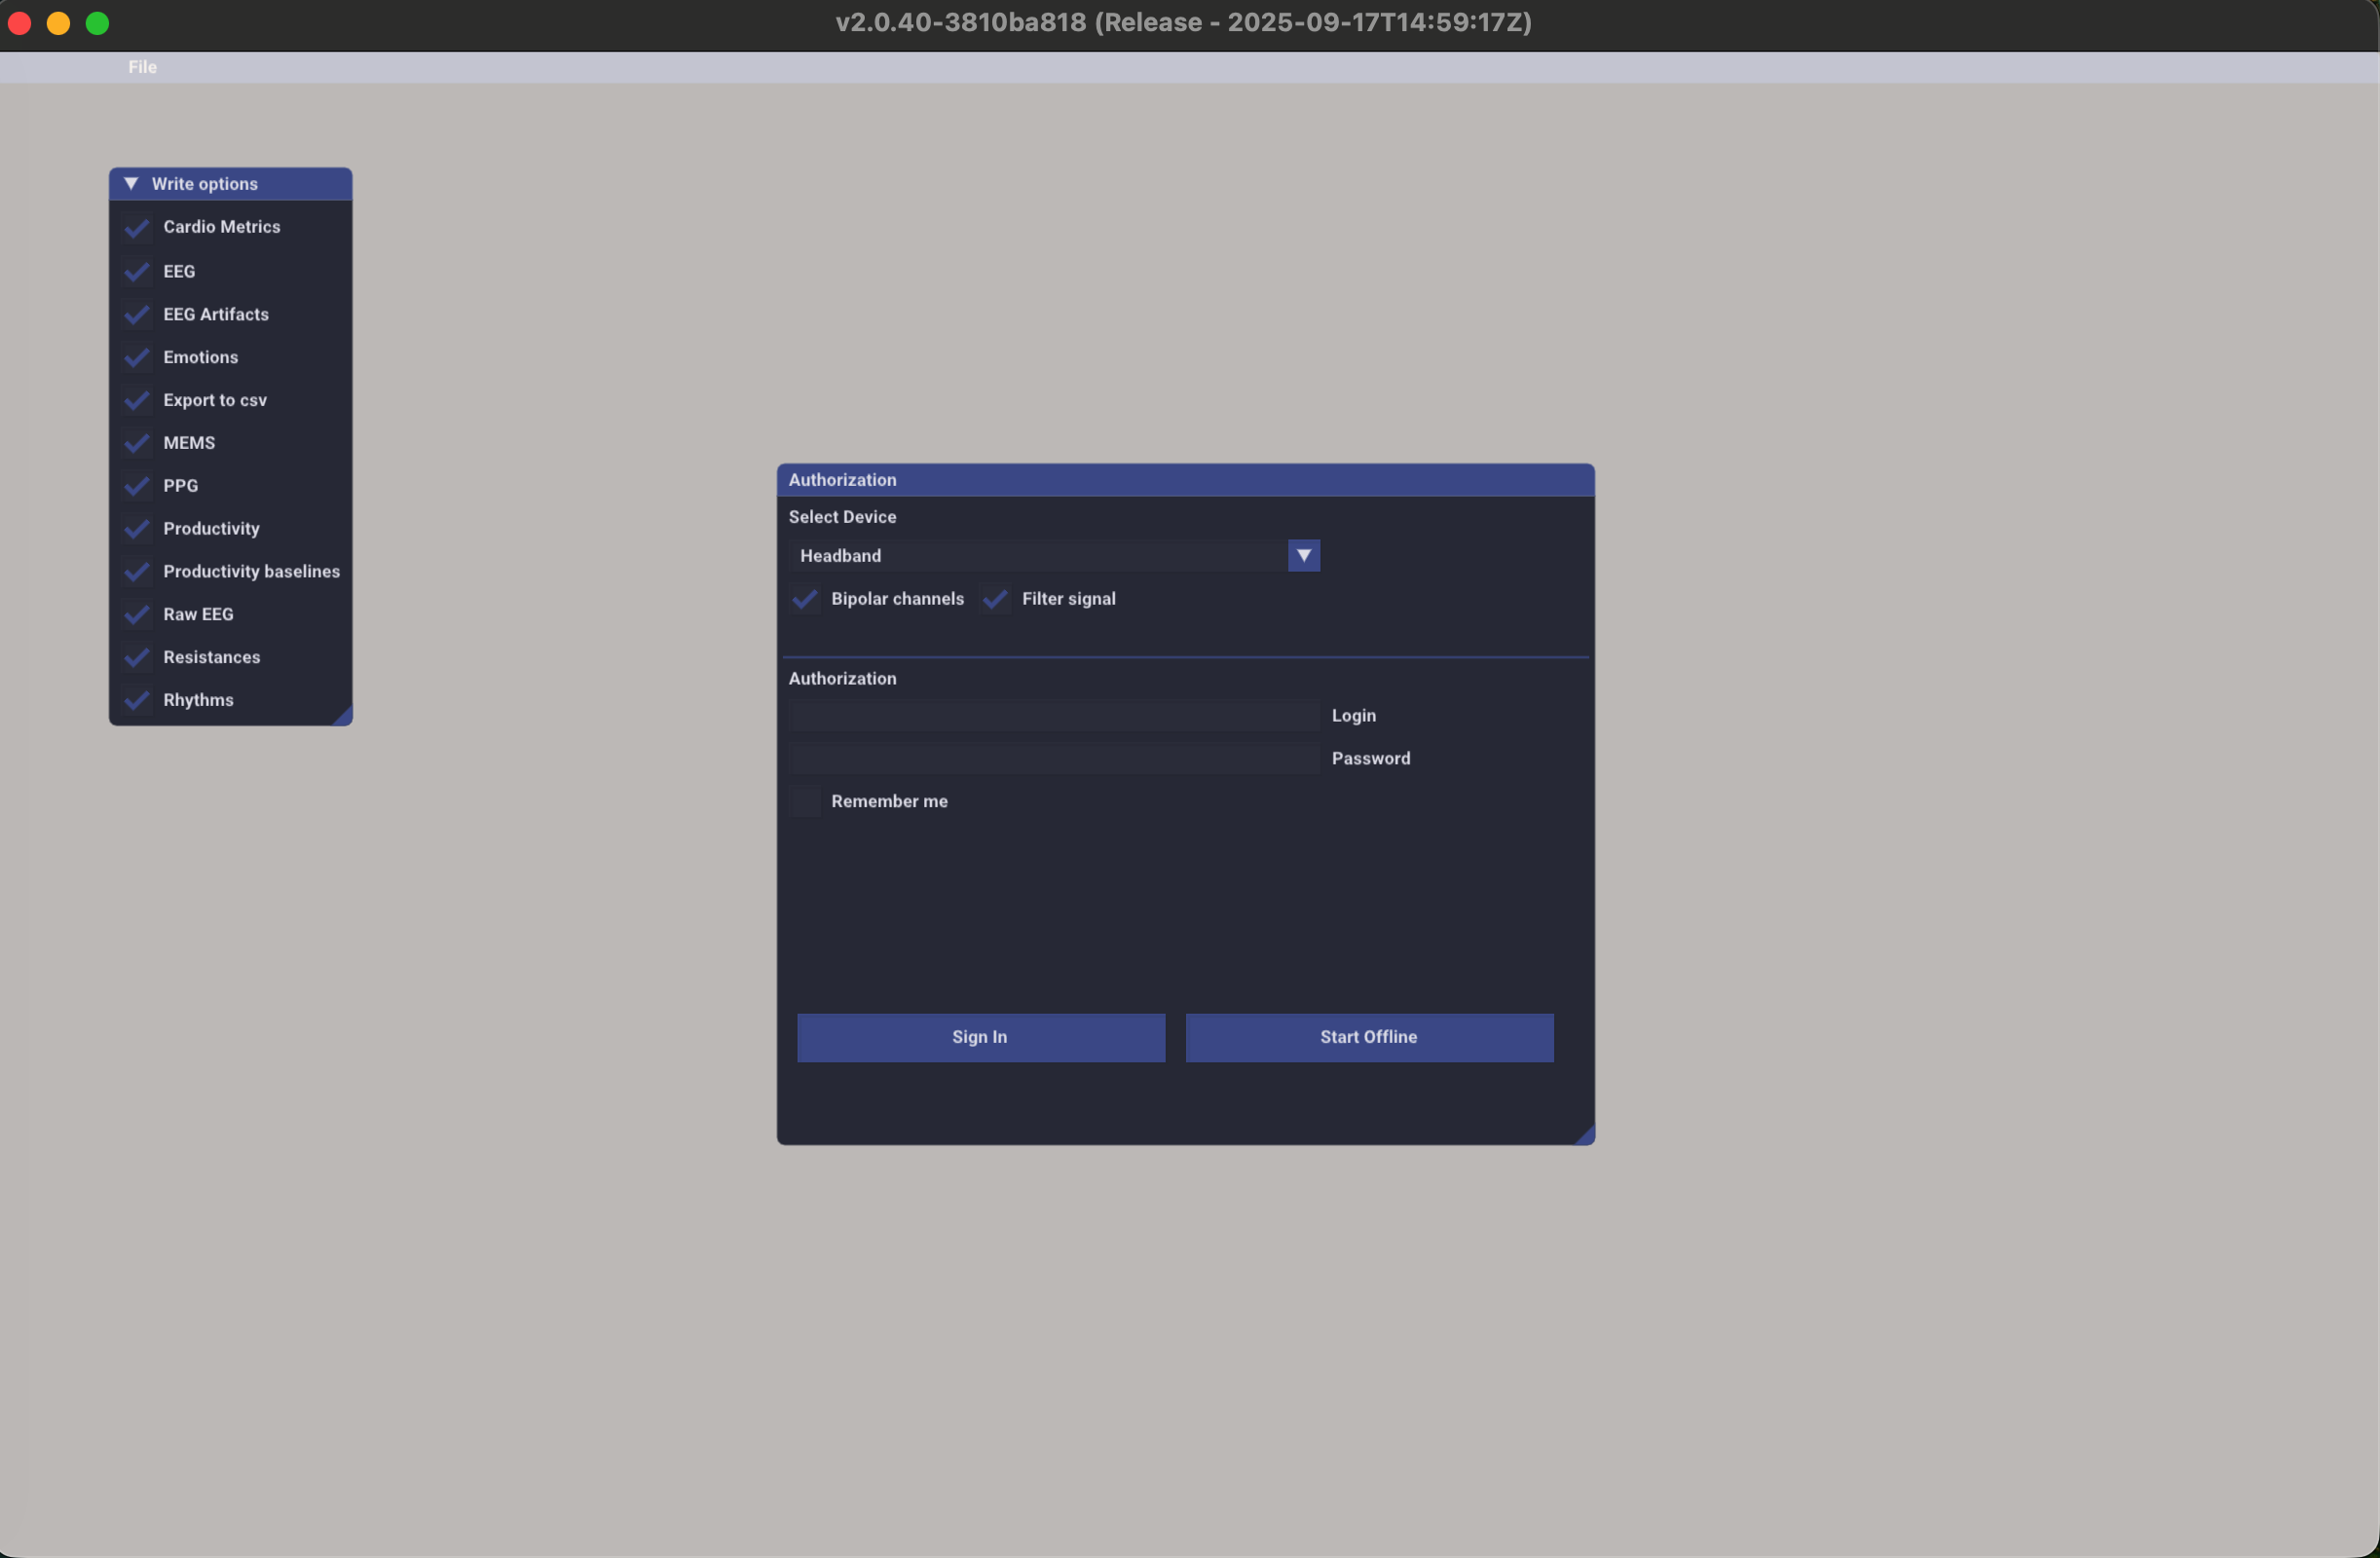
When you launch it for the first time, you will see the login screen:
Input mode
- Start Offline - work without an account. Choose this option, if you don't need cloud synchronization.
- Login with login — if you have a Neiry account.
Entering a license key
If the program asks for a license key, insert the key you received in step 6. It's done once.
Setting up Write Options - what to write
Pay attention to the panel Write Options on the left side of the screen. This is a critical setting - it determines what data is written to the CSV export file.
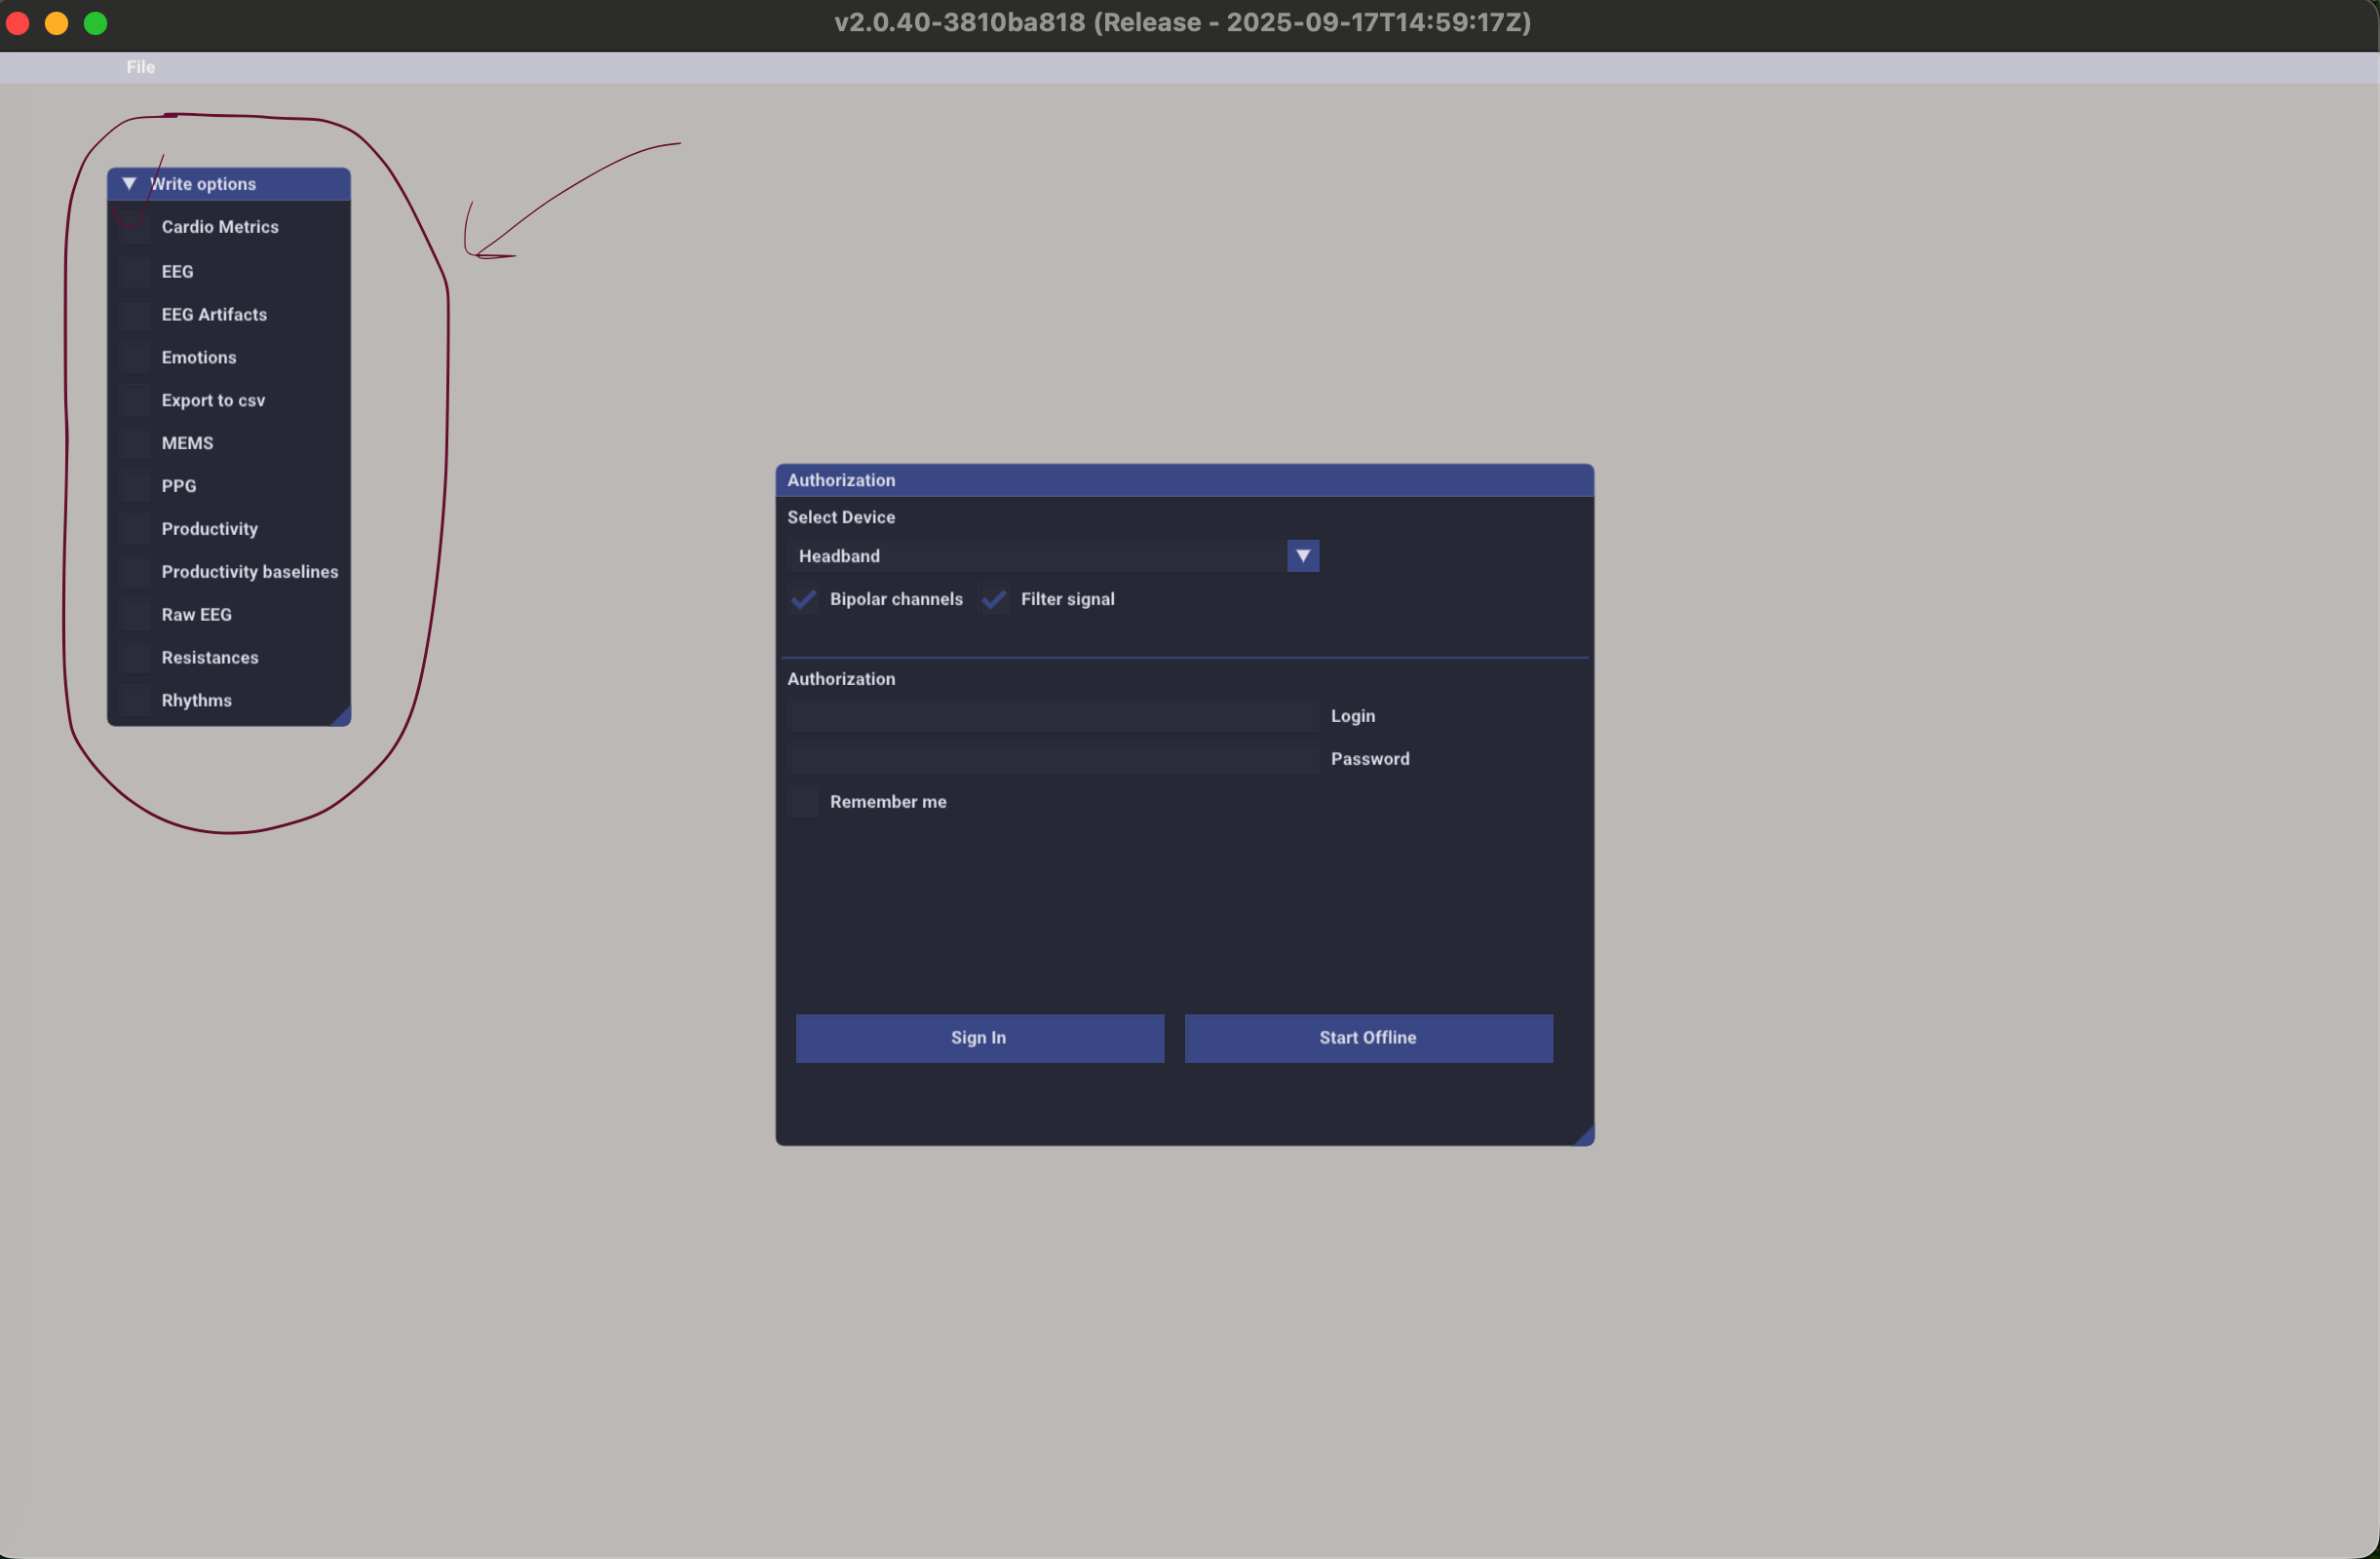
Click ALL the checkboxes:
| Check mark | What does it record? |
|---|---|
| Cardio Metrics | Pulse, heart rate variability, Baevsky stress index |
| EEG | Basic EEG metrics (rhythm powers, indices) |
| EEG Artifacts | Information about the presence of artifacts at each moment in time |
| Emotions | Emotion scales (Attention, Relaxation, Cognitive Load, Cognitive Control) |
| Export to csv | Necessarily! Without this, the data will not be exported |
| MEMS | Accelerometer and gyroscope data (head position) |
| PPG | Raw photoplethysmogram signal |
| Productivity | Fatigue Score, Concentration Index, Relaxation Index, Alpha Gravity |
| Productivity baselines | Basic productivity values (after calibration) |
| Raw EEG | Raw EEG signal (for in-depth analysis) |
| Resistances | Electrode impedance (contact quality) |
| Rhythms | Alpha/beta/theta/delta power |
Checking the connection
After connecting the tracker, you will see the main dashboard of the program:
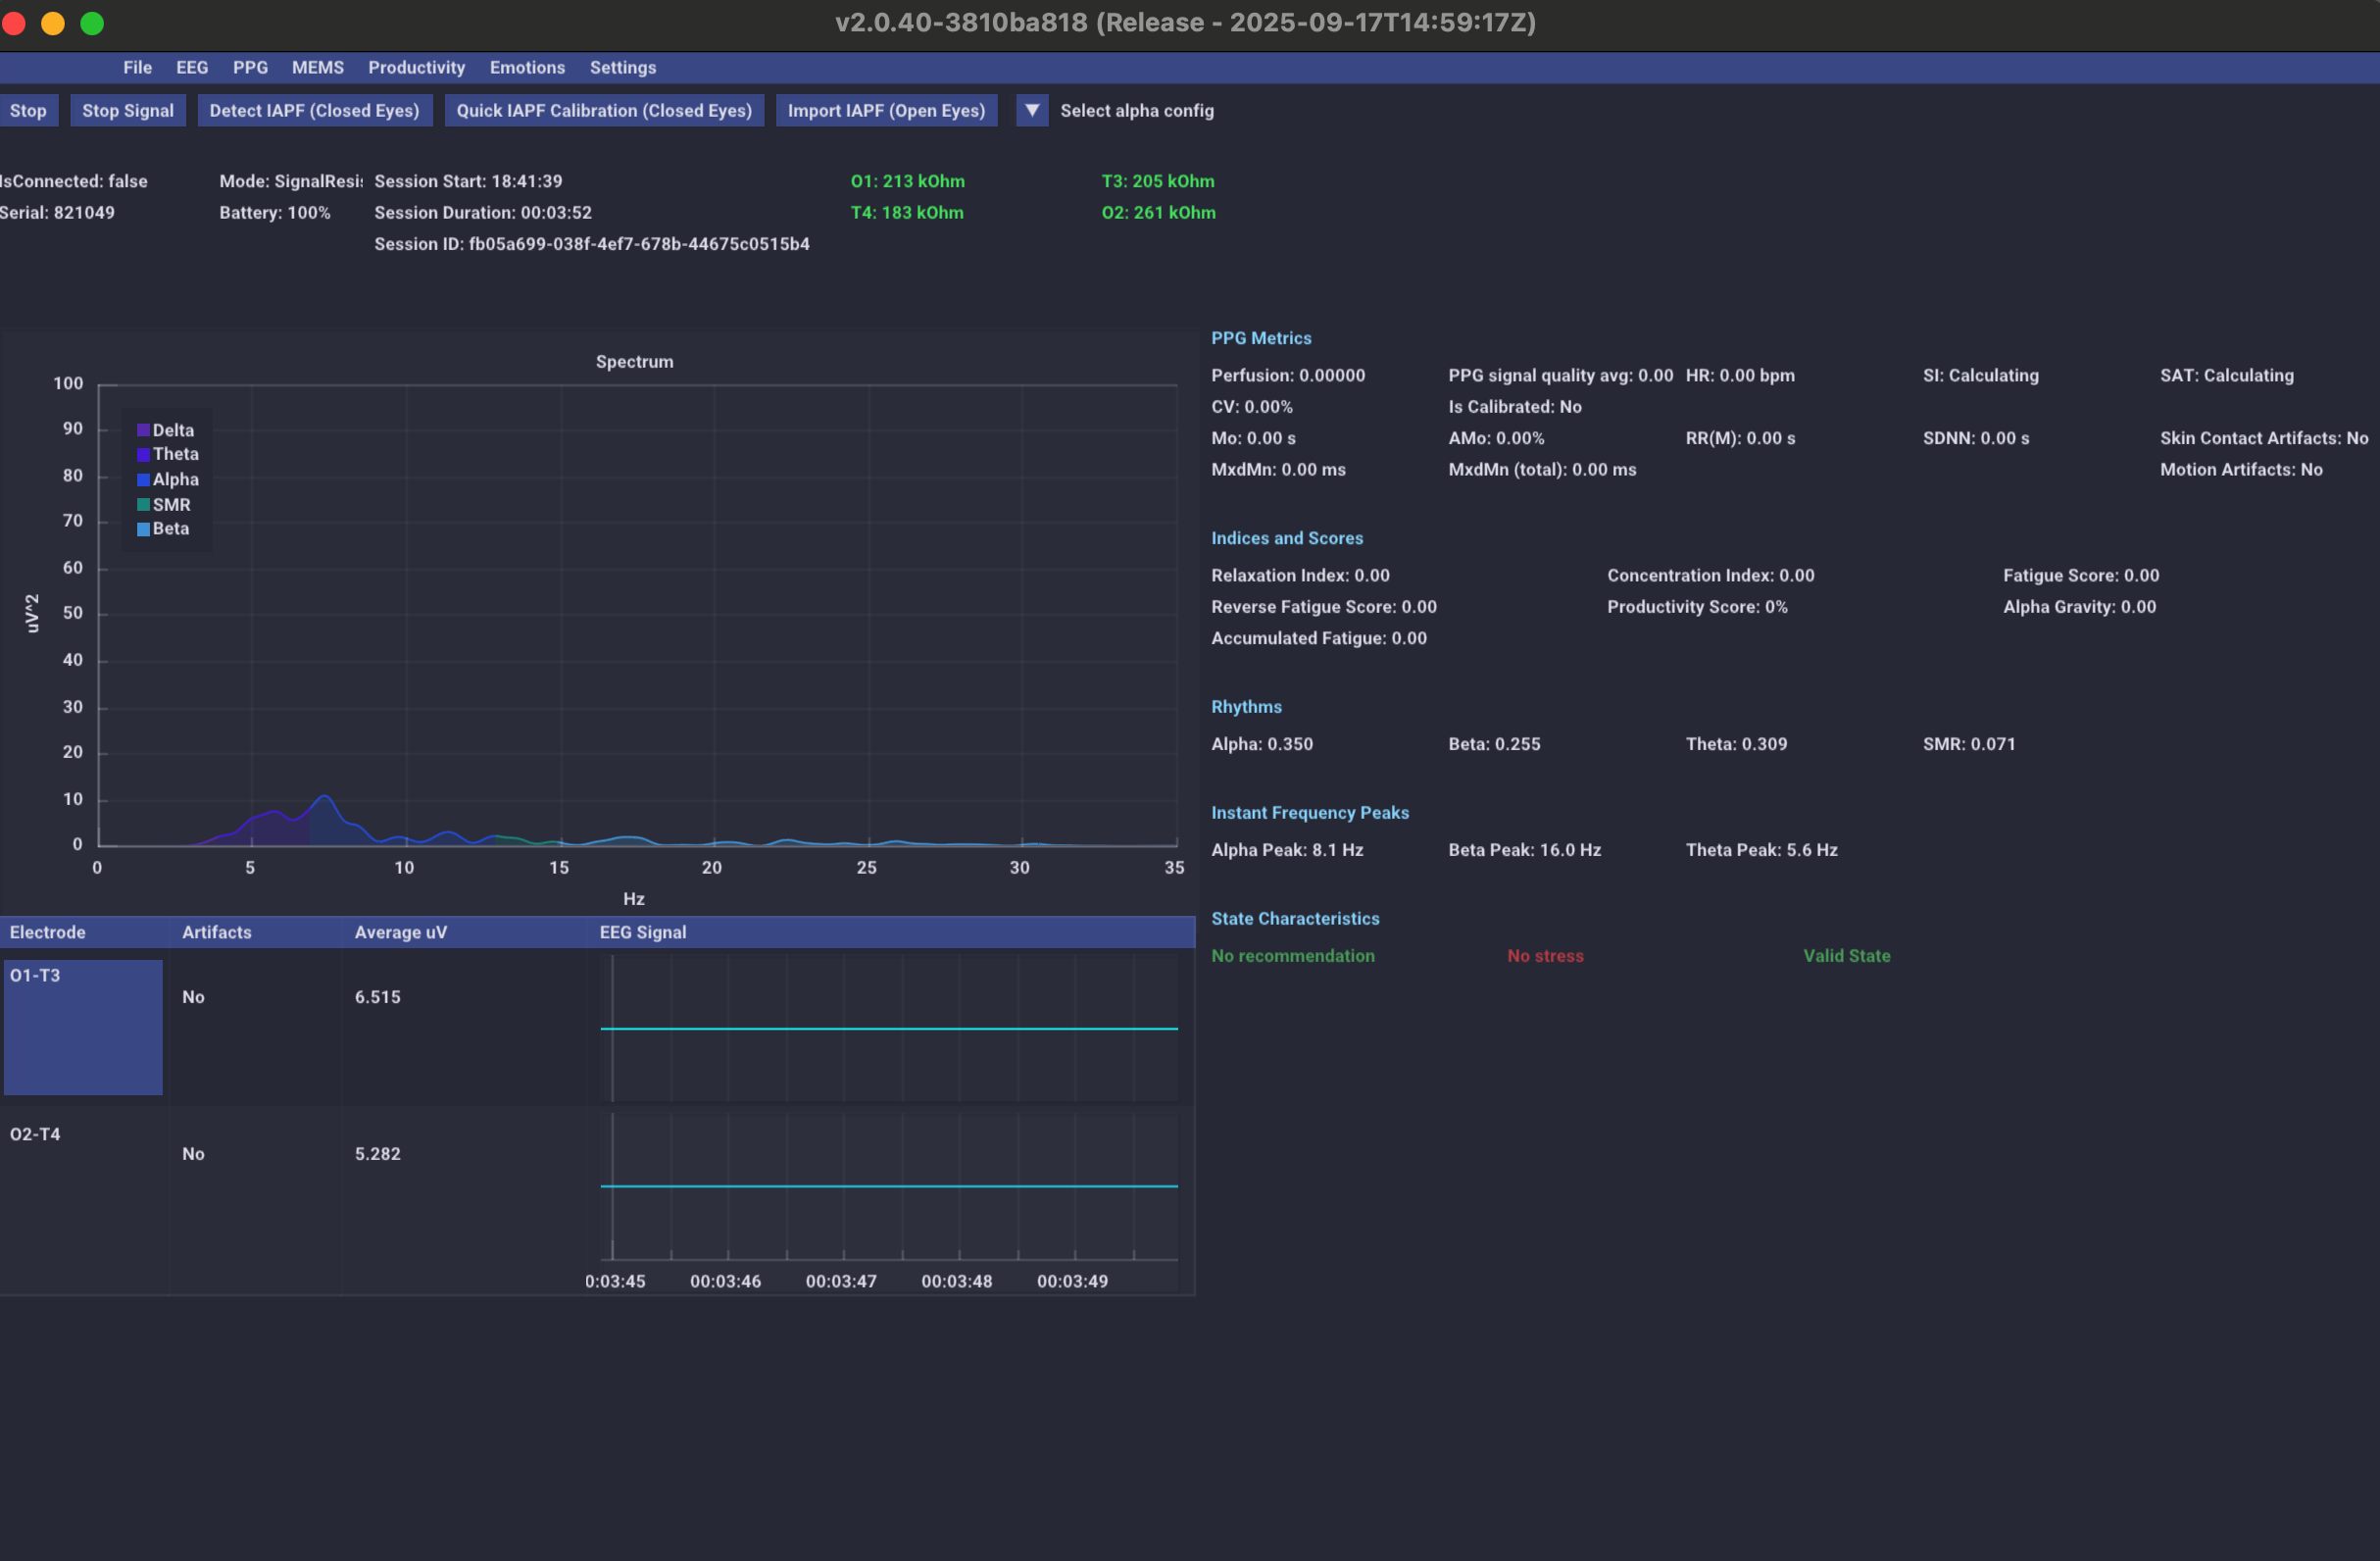
Make sure the interface shows:
| Field | What should be | Where is |
|---|---|---|
| IsConnected | true | Upper left corner |
| Battery | >15% | Next to IsConnected |
| Serial | Your serial number | Ibid. |
| Mode | SignalRes | Next to Battery |
If IsConnected = false - the tracker is not connected. Return to step 7.
▶ Video review of the programs Capsule (Yandex.Disk) interfaceThe video shows an overview of the program interface. The only thing that is not in the video is the steps for pairing the tracker and connecting Bluetooth, they are described above in step 7.
Calibration is the most important step
Calibration is a process in which the software determines your individual baselines. Each person has their own “normal” level of brain activity, heart rate, and rhythm variability. Calibration fixes your personal reference point - baseline (the median of your indicators in a calm state). All further measurements will show a deviation from this norm.
The program distinguishes three calibration steps:
- IAPF (Individual Alpha Frequency) Calibration
- Baseline calibration (baseline metrics)
- Calibration of cardiometrics (occurs automatically)
Step A - Quick IAPF Calibration
Find the button in the top panel of the program Quick IAPF Calibration (Closed Eyes):
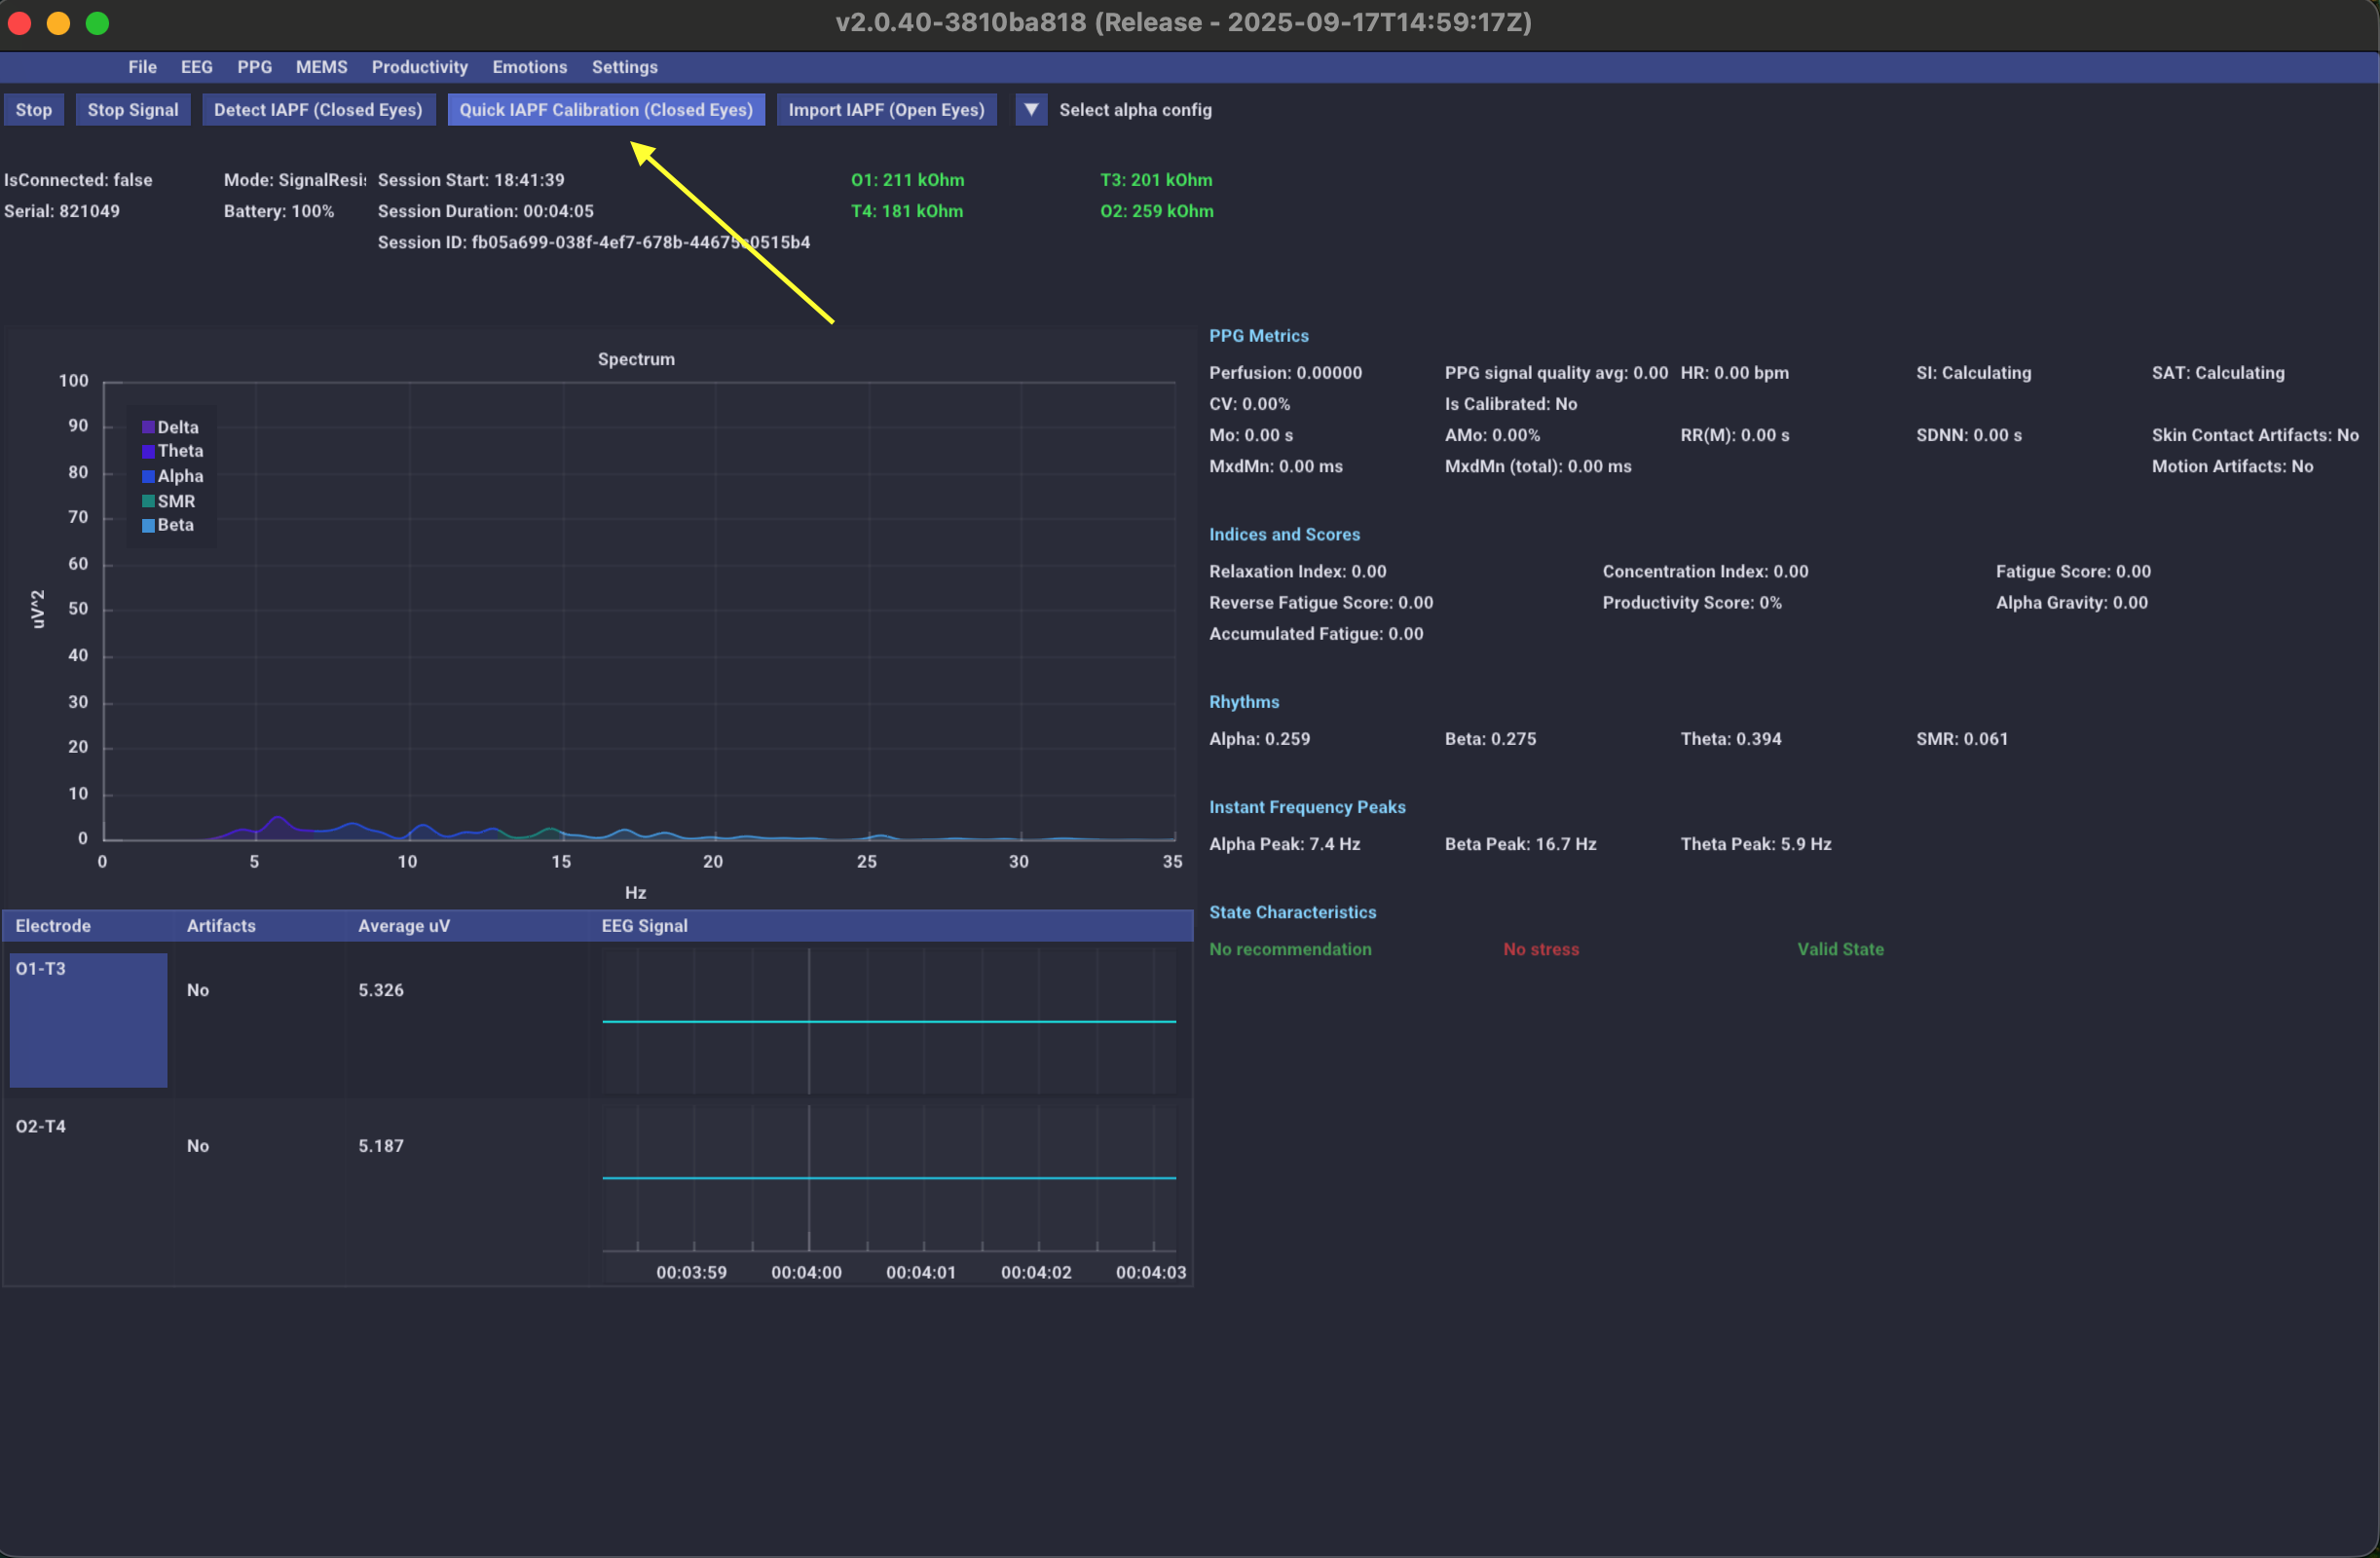
Procedure:
- Click the button Quick IAPF Calibration (Closed Eyes)
- Close your eyes
- Relax. Sit still. Don't think about anything special - just sit with your eyes closed
- Wait for completion (30–60 seconds)
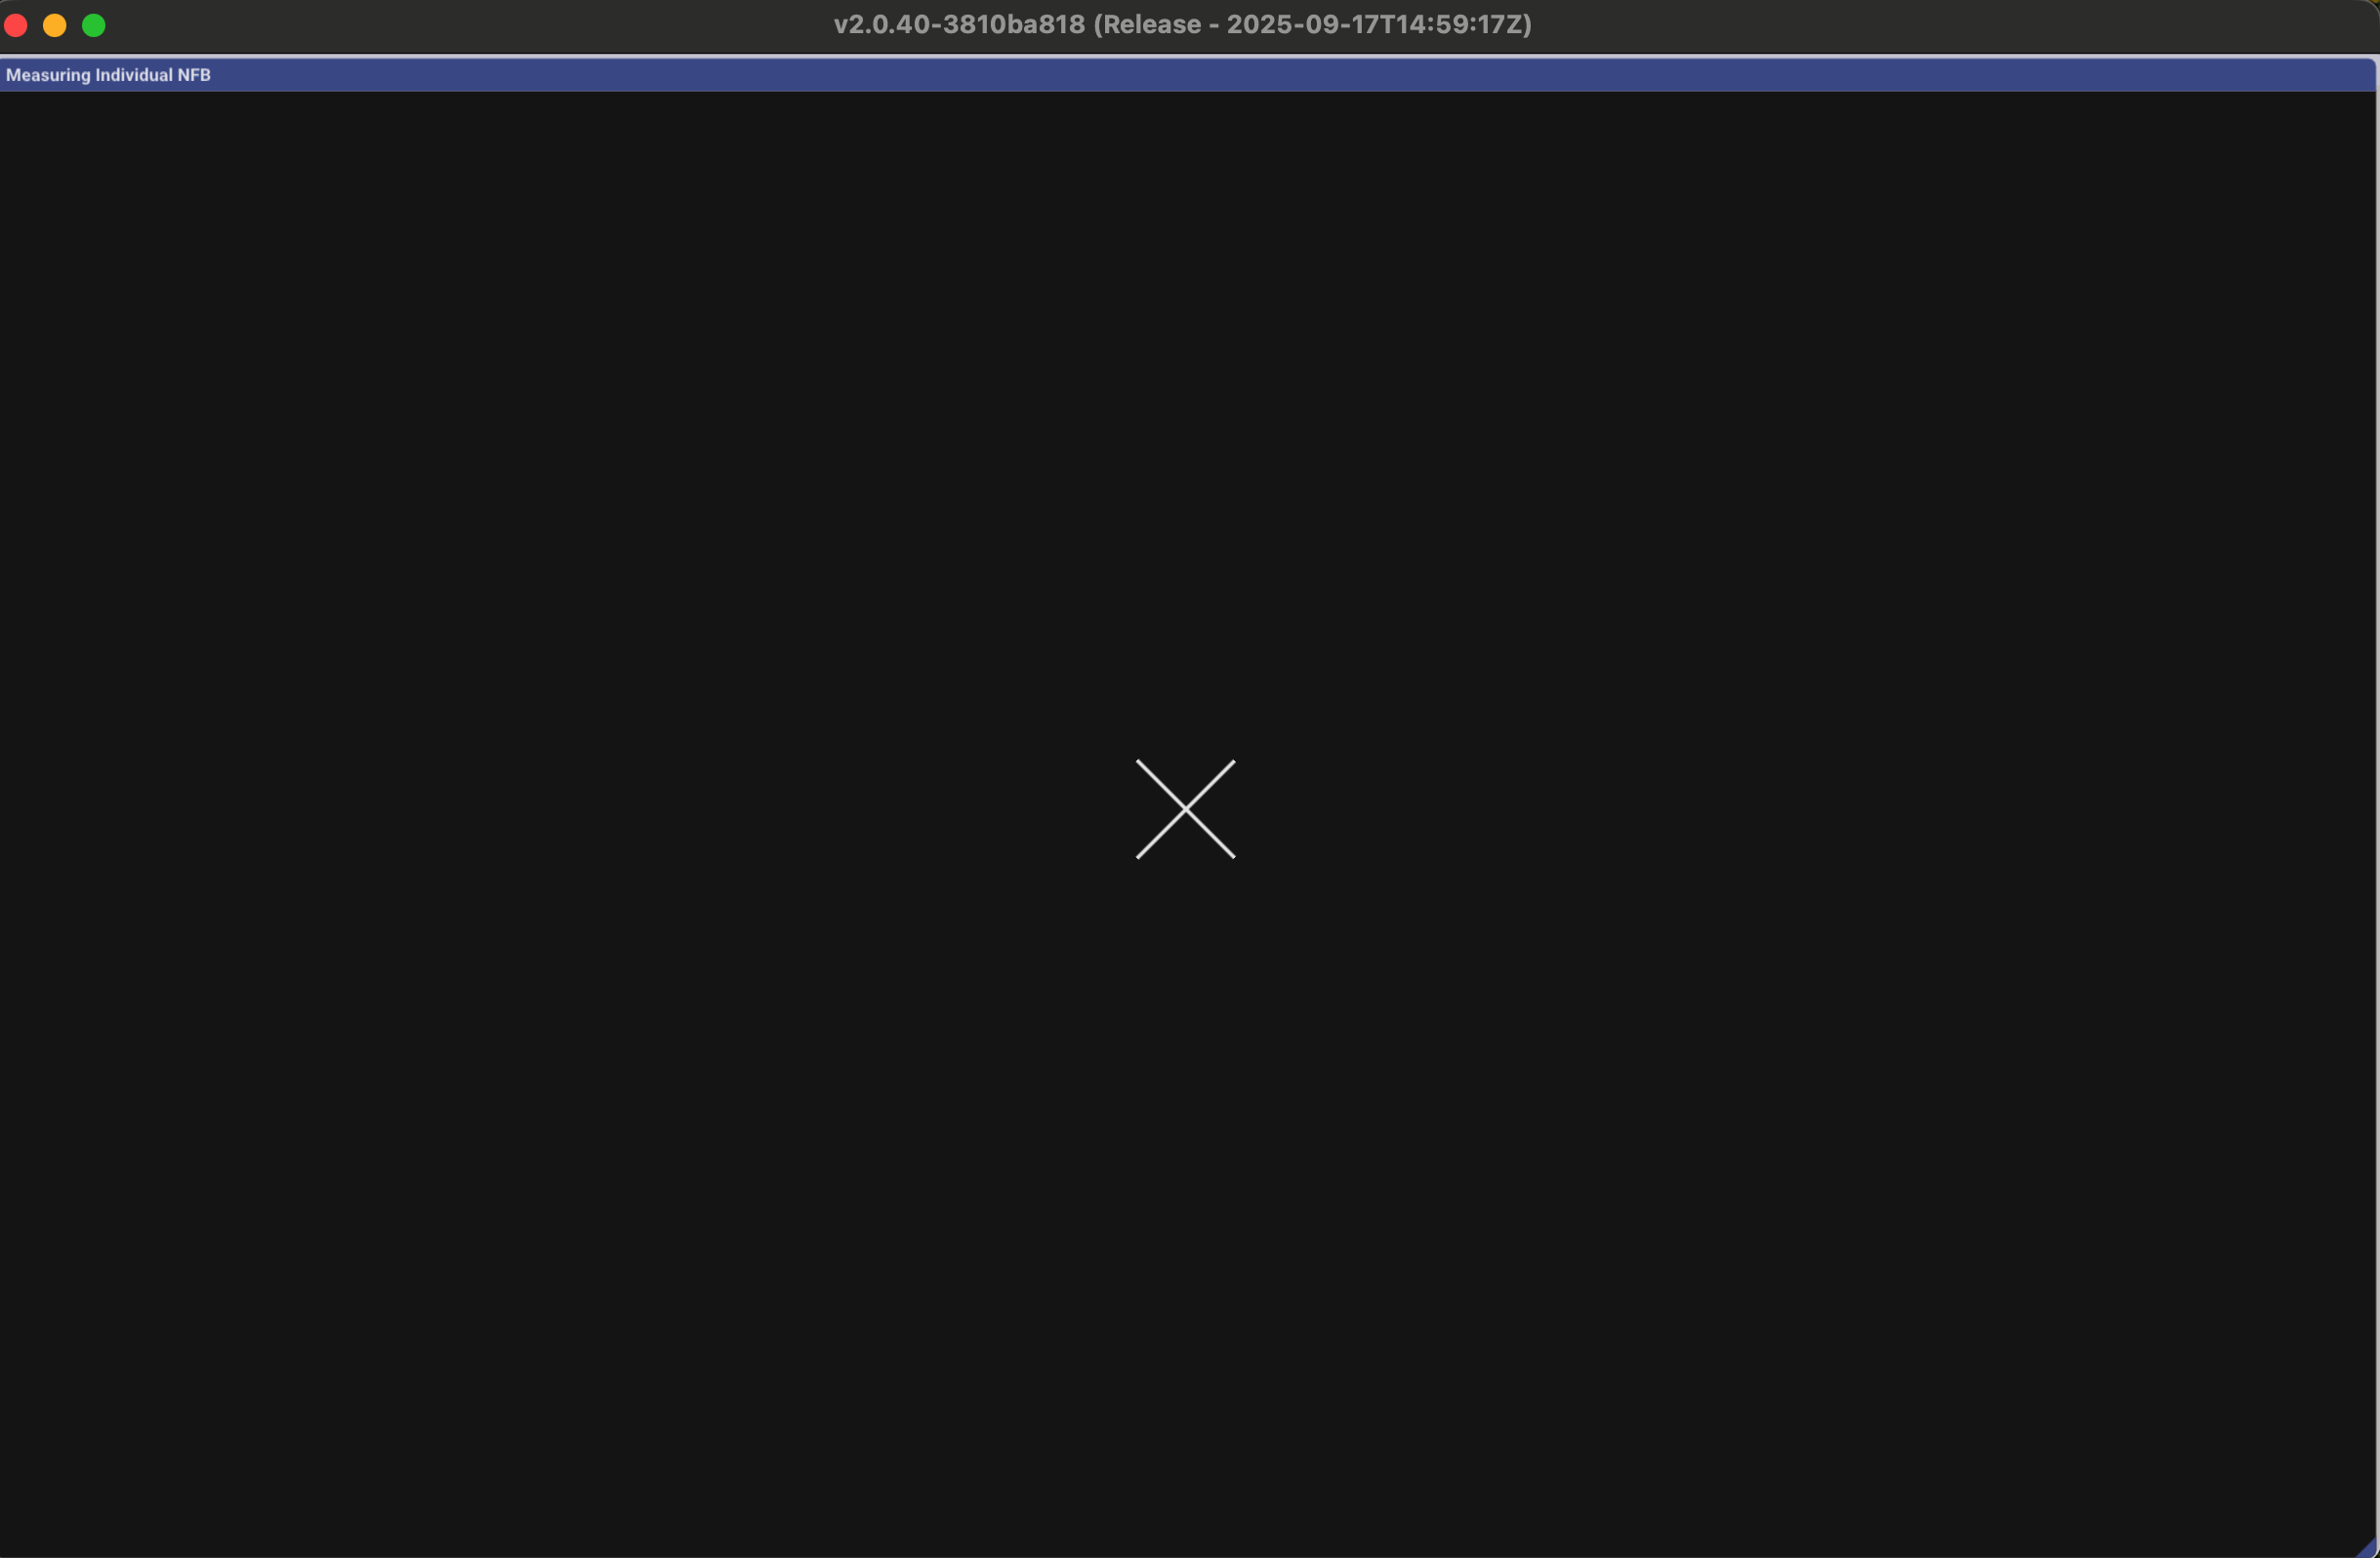
What's happening: the system determines your individual alpha frequency (IAPF) - it's like a fingerprint of your brain. IAPF is the maximum peak frequency of the alpha band. For each person, the alpha rhythm operates at its own frequency (usually 9.5–11.5 Hz), and this frequency is genetically determined by 70–80%. Based on the IAPF, the program determines the boundaries of your individual alpha range and divides it into two sub-bands: A1 (TF to IAPF) and A2 (IAPF to BF).
Step B - Calibrate Baselines
After completing IAPF calibration, find the button Calibrate Baselines in the top panel:
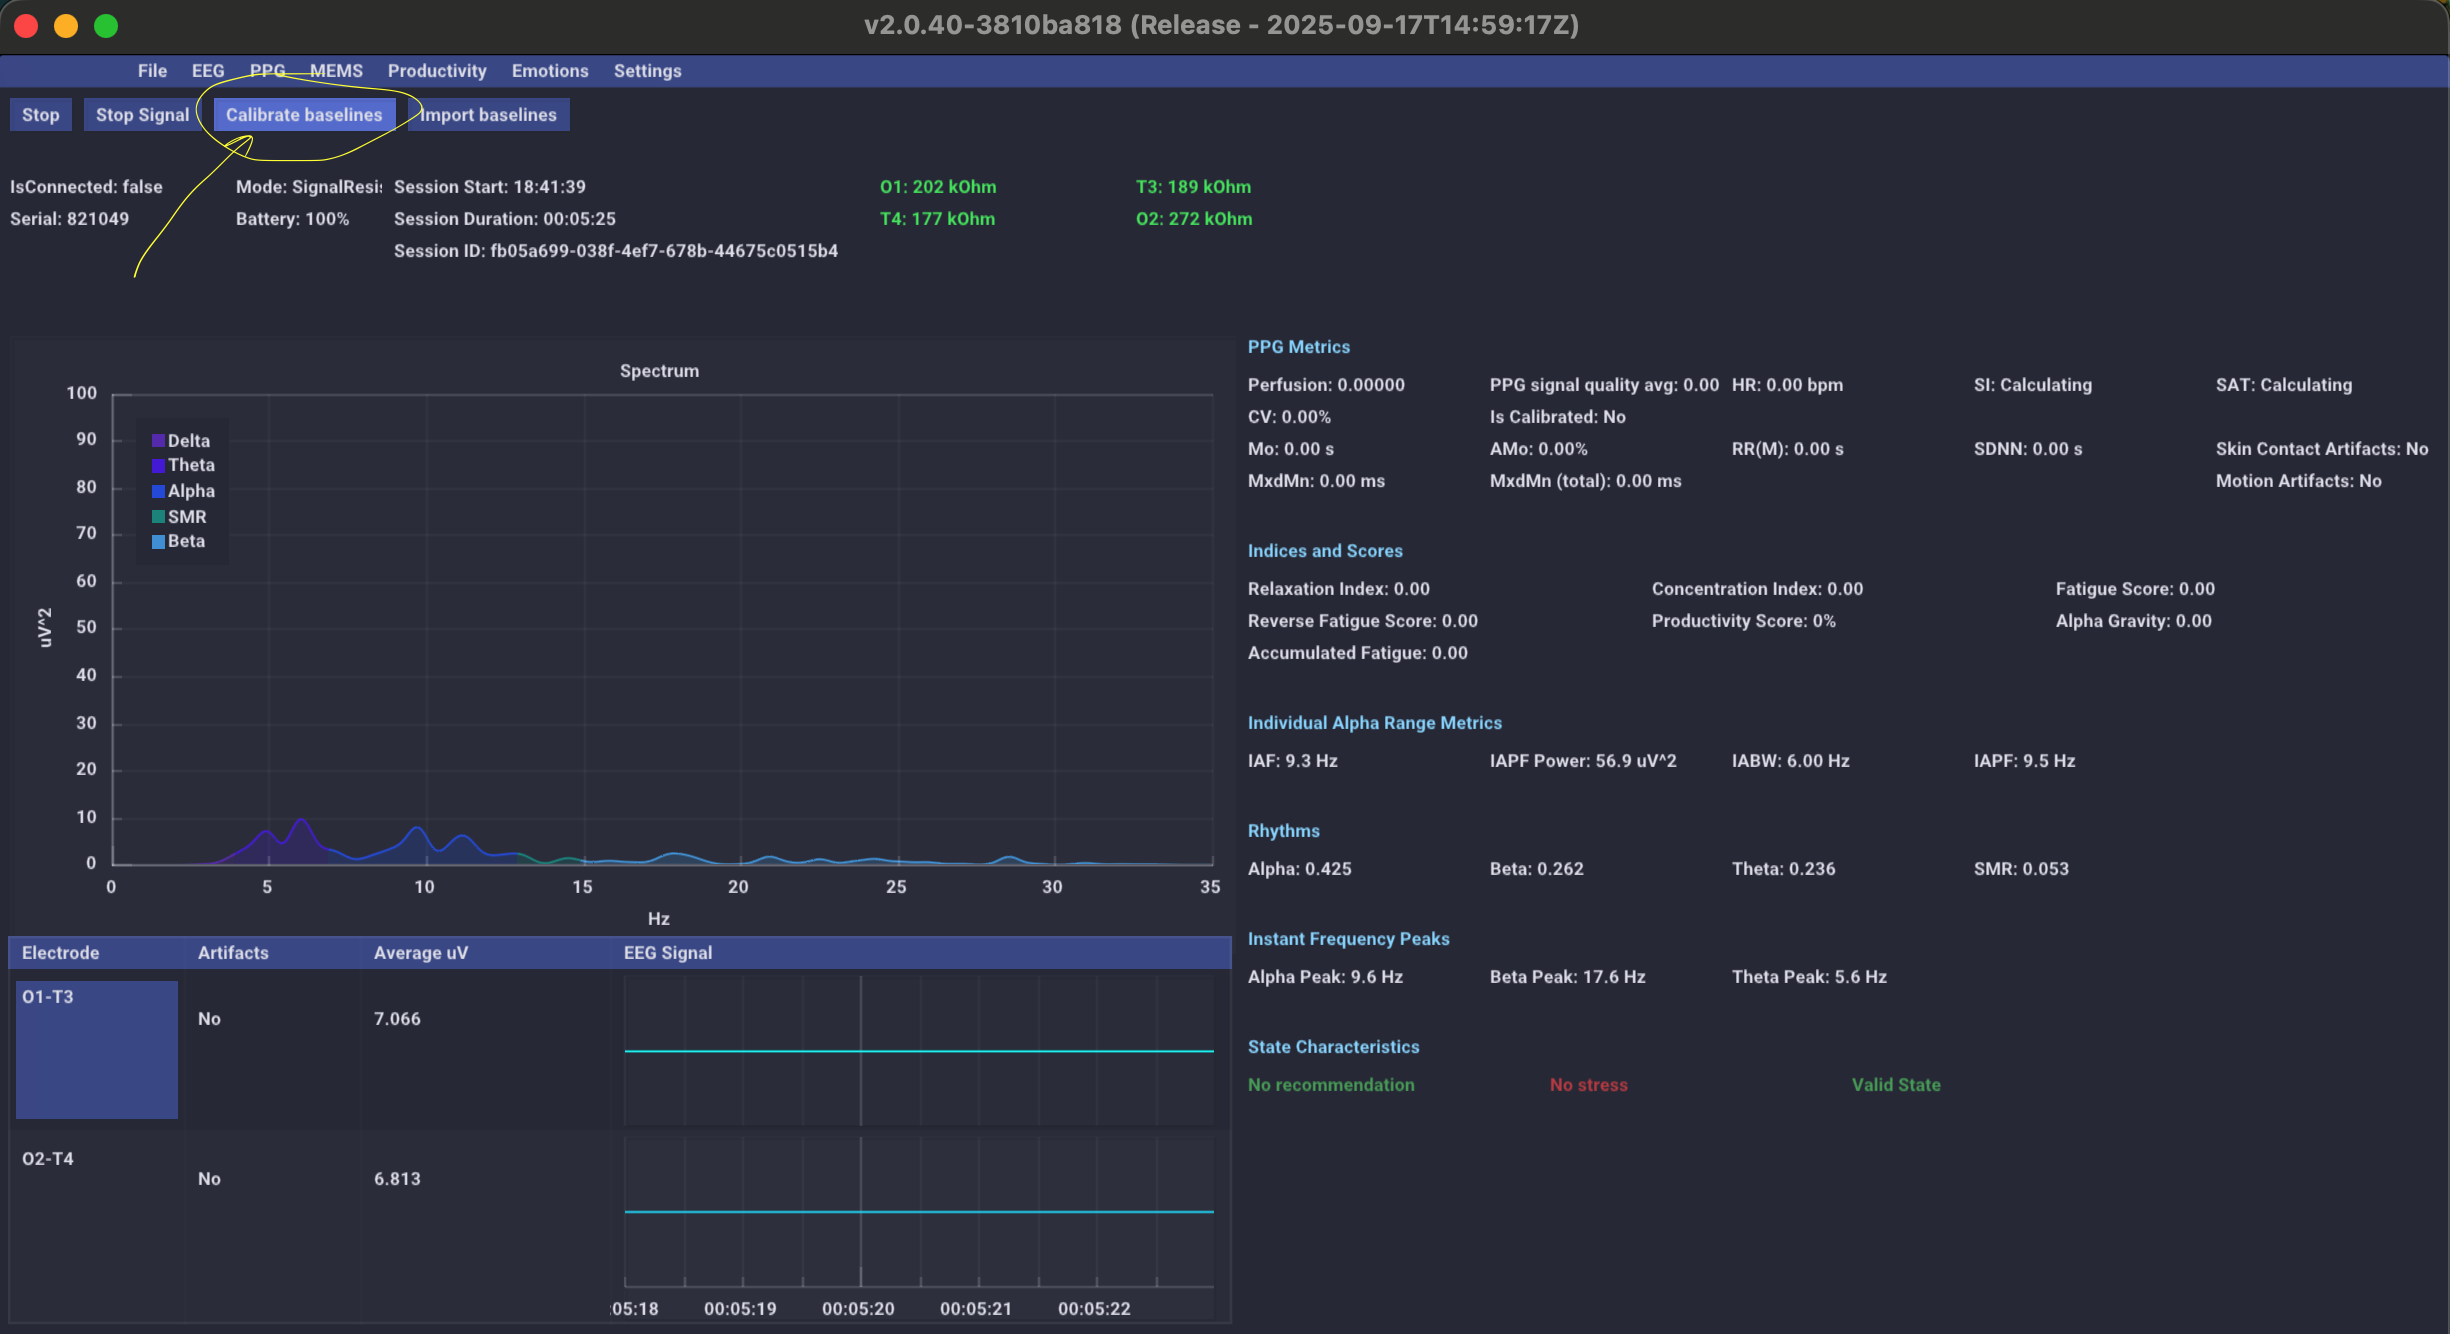
Procedure:
- Click the button Calibrate Baselines
- Sit quietly with open eyes - the program will record your basic indicators
What's happening: the system remembers your “norm” - basic levels (50th percentile = median) of concentration, relaxation, fatigue, pulse. For example, if your Fatigue Score baseline at the beginning of the session = 1, and after two hours it increased to 2–3, then relative to your baseline state your fatigue has increased by 100–200%.
Important Calibration Rules
- Calibration is done once - data is saved. Re-calibration is only needed if you want to update the baseline.
- Do not move during calibration. Even small head movements create artifacts.
- Don't talk. Facial muscles create electrical interference.
- Calibrate in a calm state. Not right after the gym, not after a fight, not after a liter of coffee.. Your “norm” should really be the norm.
- The order is strictly important: first IAPF, then Baselines. Not the other way around.
Your first measurement and data marking
Everything is set up, calibrated, the tracker is on the head, the contact is good. It's time to take a measurement.
Start recording
Data recording starts automatically when connecting the tracker. Data is written in the background from the first second - you don't need to press the "Record" button. But in order to understand the exported CSV table later - which moment corresponds to which state — markings are needed.
Session marking - Data Markup buttons (1–2–3–4–5)
This key tool for data analysis. There are numbered buttons in the upper right part of the interface Data Markup (1–5):
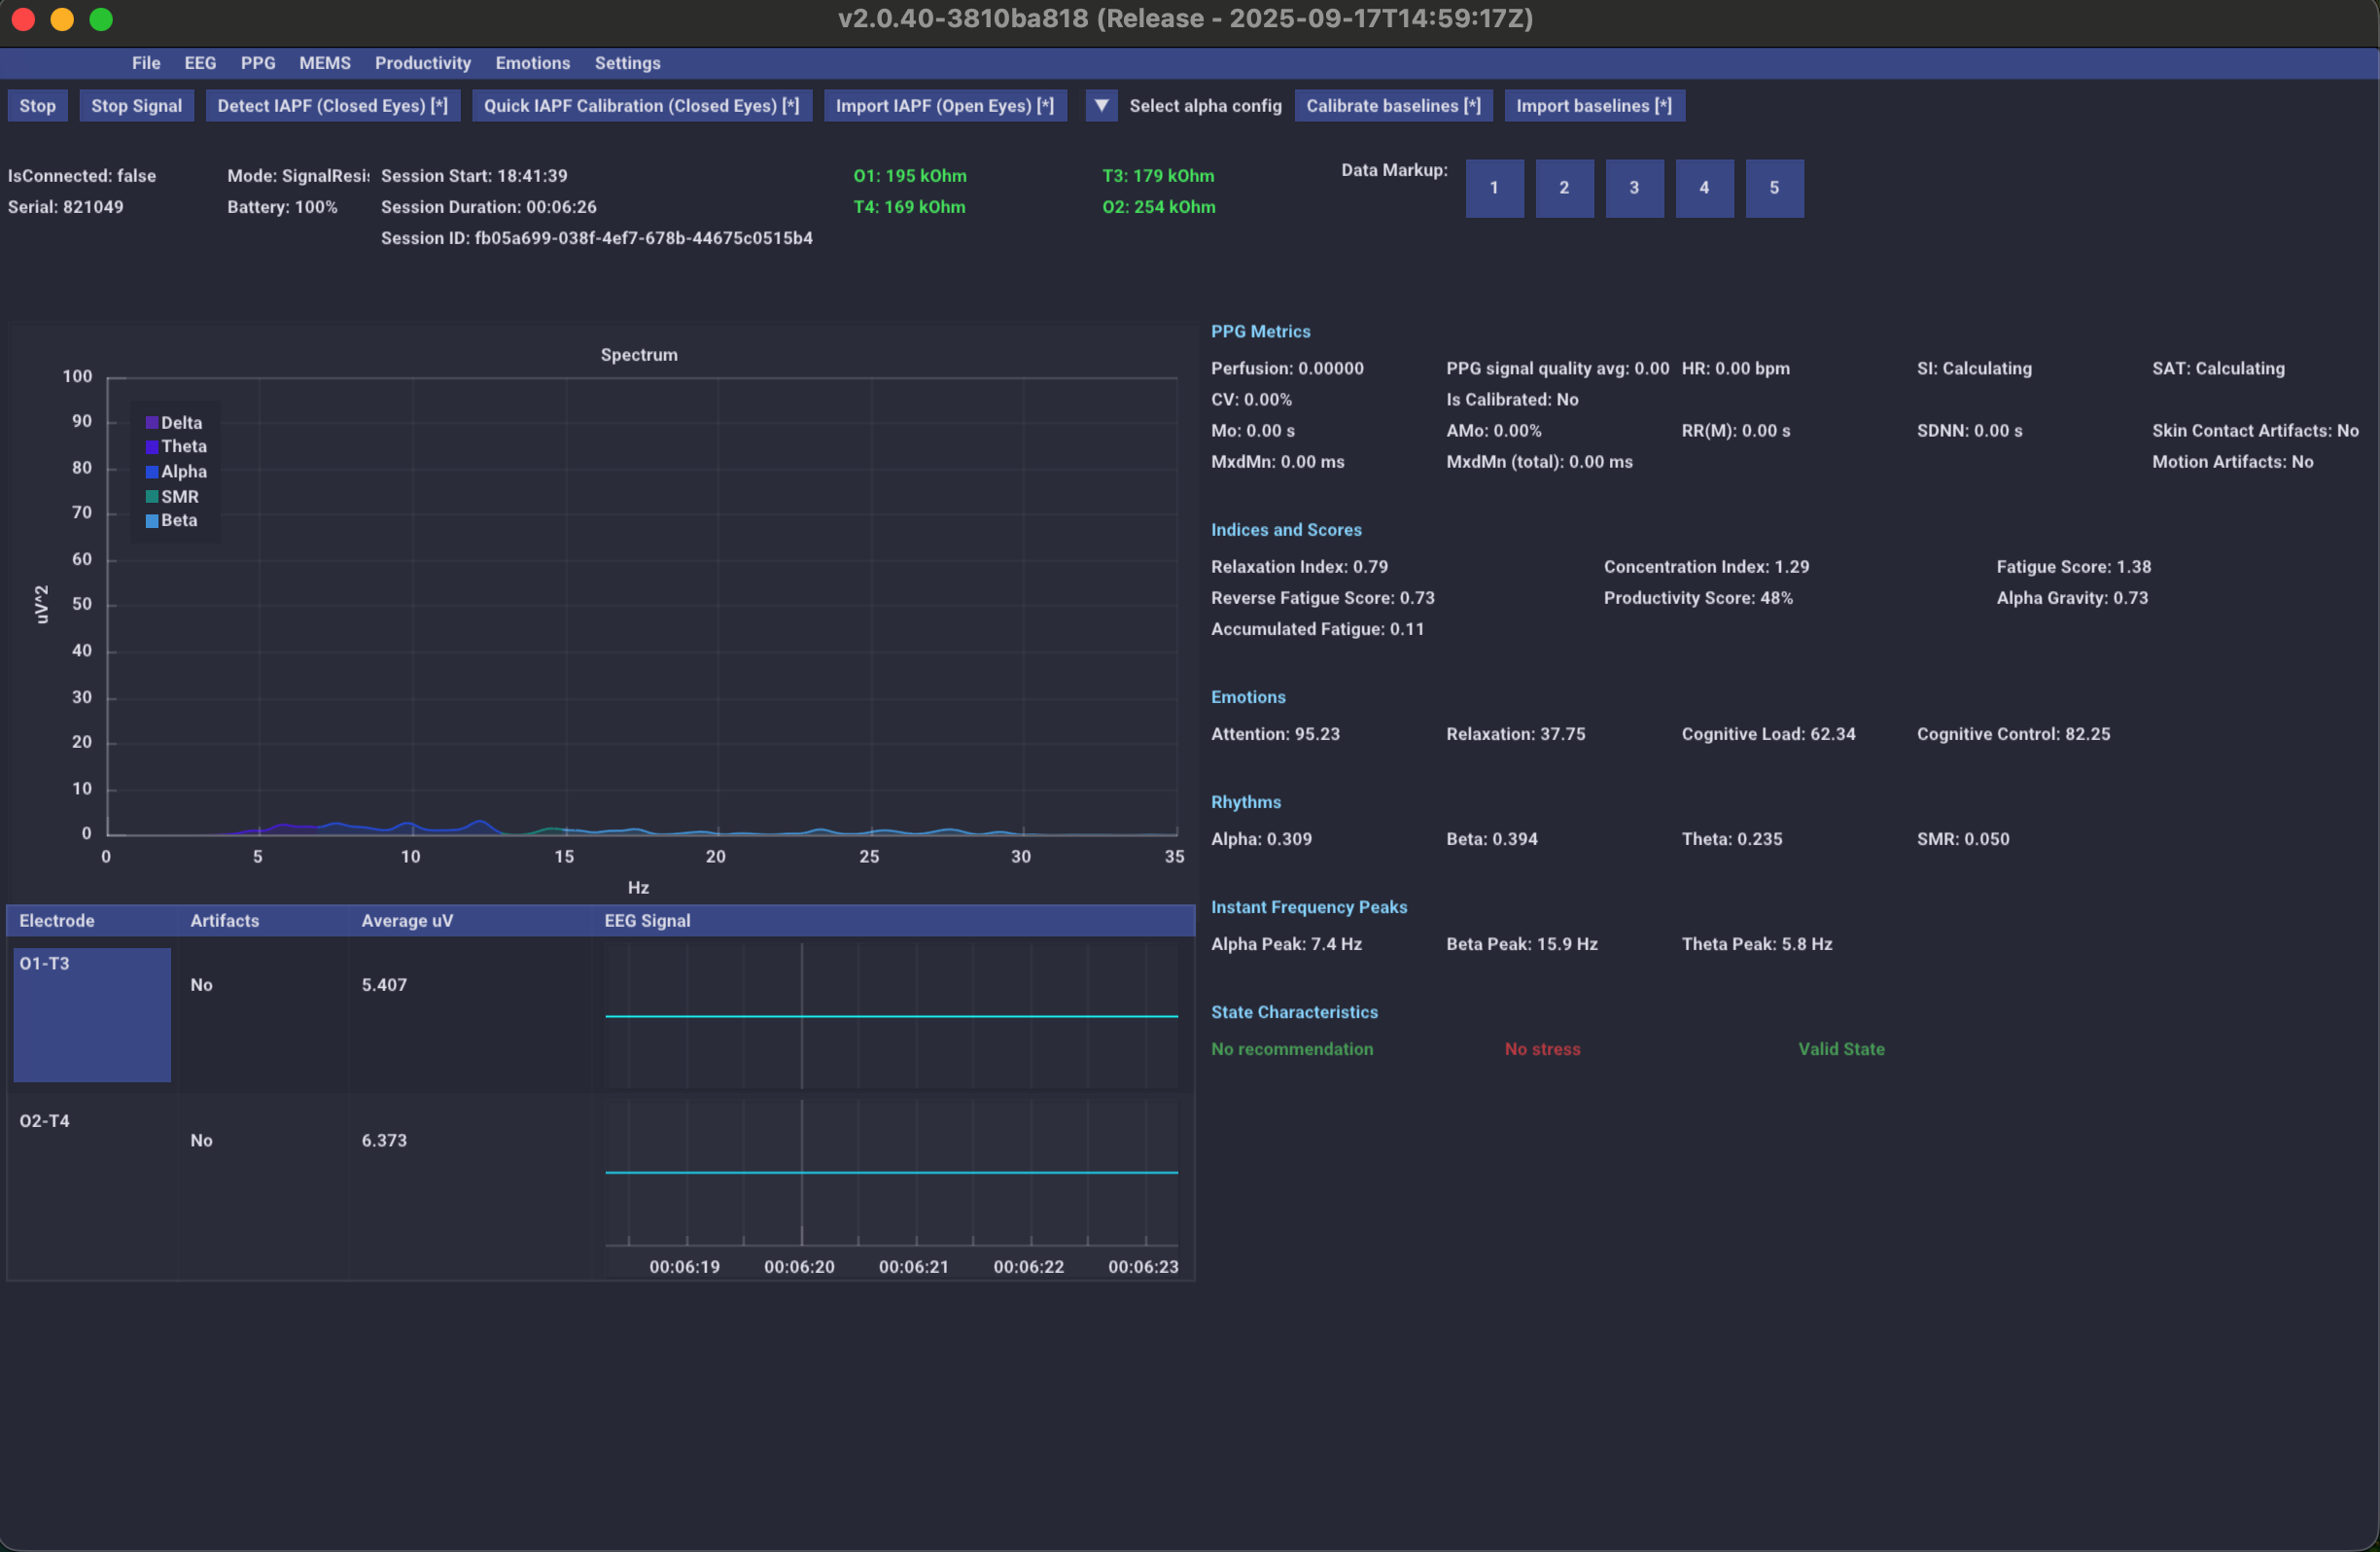
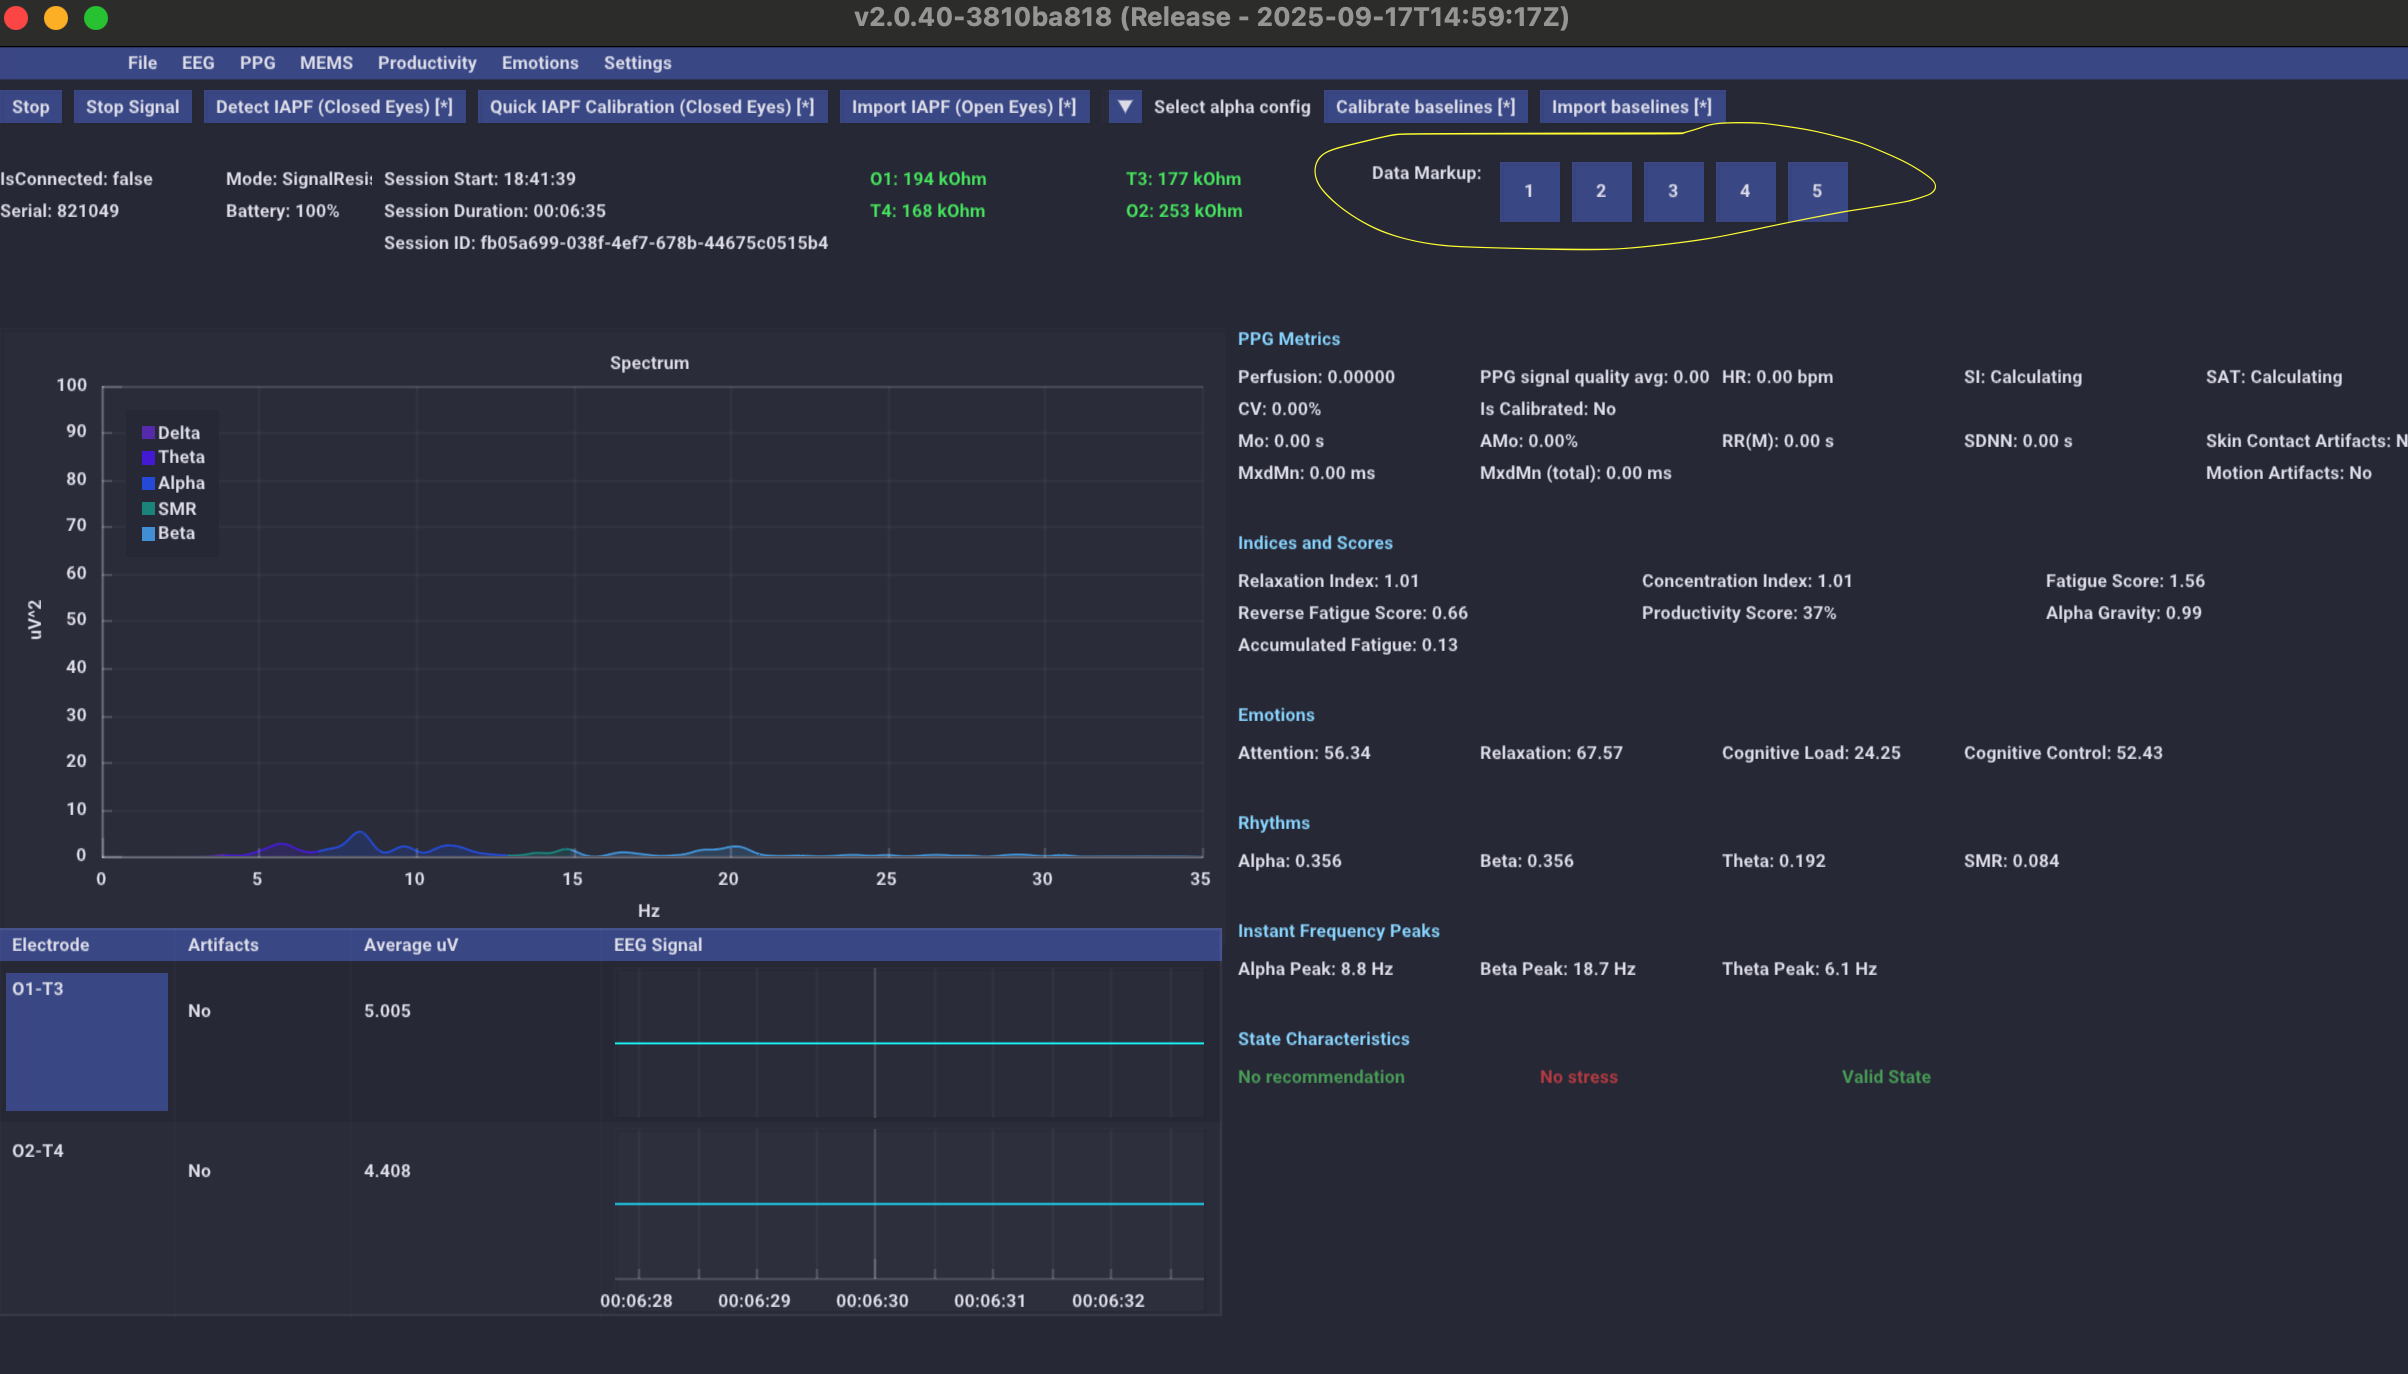
Why do you need markup - how it works
When you have connected the capsule - data recording is already in progress. The program continuously records all metrics every second. But when you then open the exported CSV file, you will see thousands of lines of numbers - and without markup it is impossible to understand where one state ends and another begins.
Data Markup buttons solve this problem: when you click the button, the CSV table appears marker with number (1, 2, 3, 4 or 5), tied to a specific point in time. This allows you to:
- Accurately determine from when Phase 1 has begun (e.g. normal sitting)
- Accurately determine from when phase 2 has begun (eg meditation)
- Compare metrics to and during target state
- Install and check hypotheses based on objective data
How to use markup - step by step
| Step | When to press | Which button | What does this mean in the table |
|---|---|---|---|
| 1 | Sit down, relax, tracker on your head | Button 1 | Marker “phase 1 - normal state (baseline)” |
| 2 | Starting a practice/meditation/task | Button 2 | Marker “phase 2 - target state” |
| 3 | Finish your internship (optional) | Button 3 | Marker "phase 3 - completion" |
| 4–5 | At your discretion | Buttons 4, 5 | Additional markers for complex protocols |
— Clicked 1 - sit quietly for 5 minutes with your eyes open (your “normal” nervous system is recorded)
— Clicked 2 - start the practice of stopping internal dialogue
— Clicked 3 — completed the internship
In the CSV table you will then see: all rows from marker 1 to marker 2 are your normal state. All lines from marker 2 to marker 3 are the state during practice. By comparing metrics between phases, you can objectively see whether something has changed in the brain.
What is visible on the screen during measurement
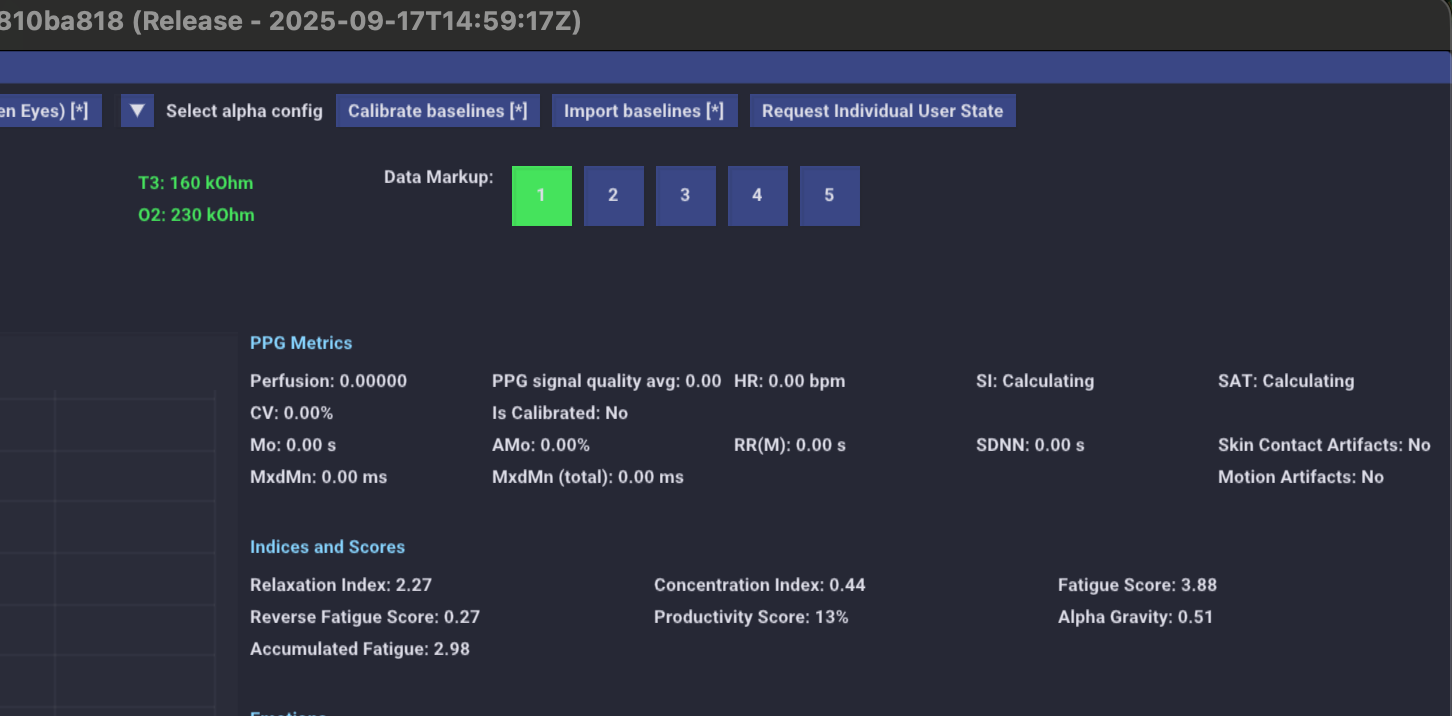
Minimum measurement duration
- 5 minutes per phase - minimum for correct HRV data
- 10+ minutes — recommended for the Accumulated Fatigue indicator
- Optimal: 5 minutes baseline (button 1) + 15–30 minutes practice (button 2)
What to do during measurement
- Sit still. Minimize head movements.
- Don't talk (unless this is part of the task).
- Don't touch the tracker During recording, move the electrodes.
- Don't tense your facial muscles - the forehead, jaw, chewing muscles create interference in the beta range, and the program can interpret this as “high brain activity”, although it is just muscle noise (an artifact).
Ending recording
Click the button Stop in the upper left corner. The data will be automatically saved.
Interface Tabs Overview
The Capsule program contains several tabs in the top menu, each of which opens a specialized set of metrics and graphs.
EEG tab - electroencephalogram
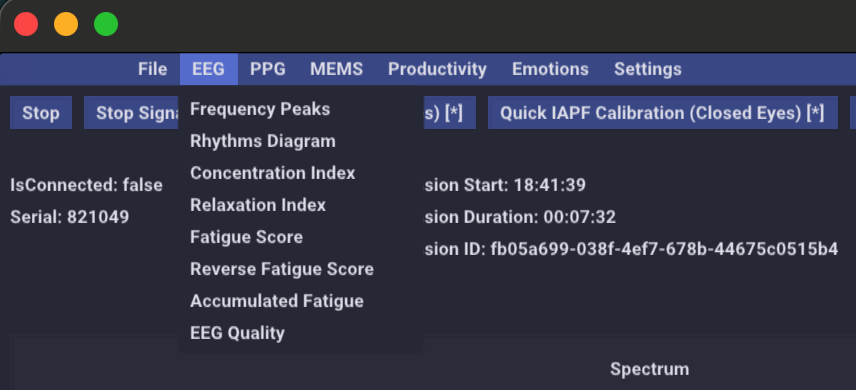
| Menu item | What does it show |
|---|---|
| Frequency Peaks | Real-time peak frequencies of alpha/beta/theta rhythms |
| Rhythms Diagram | Circular diagram of the power ratio of brain rhythms |
| Concentration Index | Graph of concentration index (beta/alpha) relative to baseline |
| Relaxation Index | Relaxation index graph (alpha/beta) relative to baseline |
| Fatigue Score | Fatigue graph (alpha + theta)/beta |
| Reverse Fatigue Score | “Inverted” index - vigor index beta/(alpha + theta) |
| Accumulated Fatigue | Accumulated fatigue on a 10-point scale since the beginning of the session |
| EEG Quality | EEG signal quality |
PPG tab - photoplethysmogram
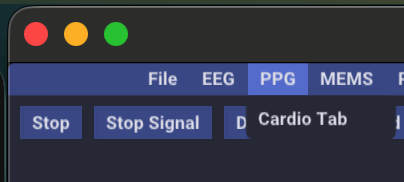
Tab PPG contains Cardio Tab — section with cardiometrics:
- Heart Rate (HR/BPM)
- Heart rate variability (SDNN, pNN50)
- Baevsky Stress Index (SI)
- Sympatho-adrenal tone index (SAT)
Productivity Tab - Productivity
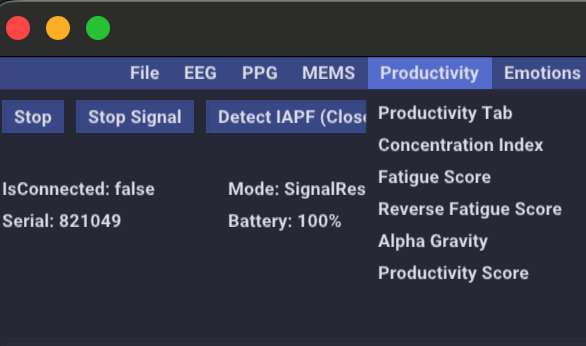
| Menu item | What does it show |
|---|---|
| Productivity Tab | General productivity dashboard |
| Concentration Index | Concentration index (beta/alpha) |
| Fatigue Score | Fatigue index |
| Reverse Fatigue Score | Vigor index |
| Alpha Gravity | Flow indicator - involvement in activities (A2/A1) |
| Productivity Score | Overall productivity score from 0 to 1 |
Cognitive States - cognitive states
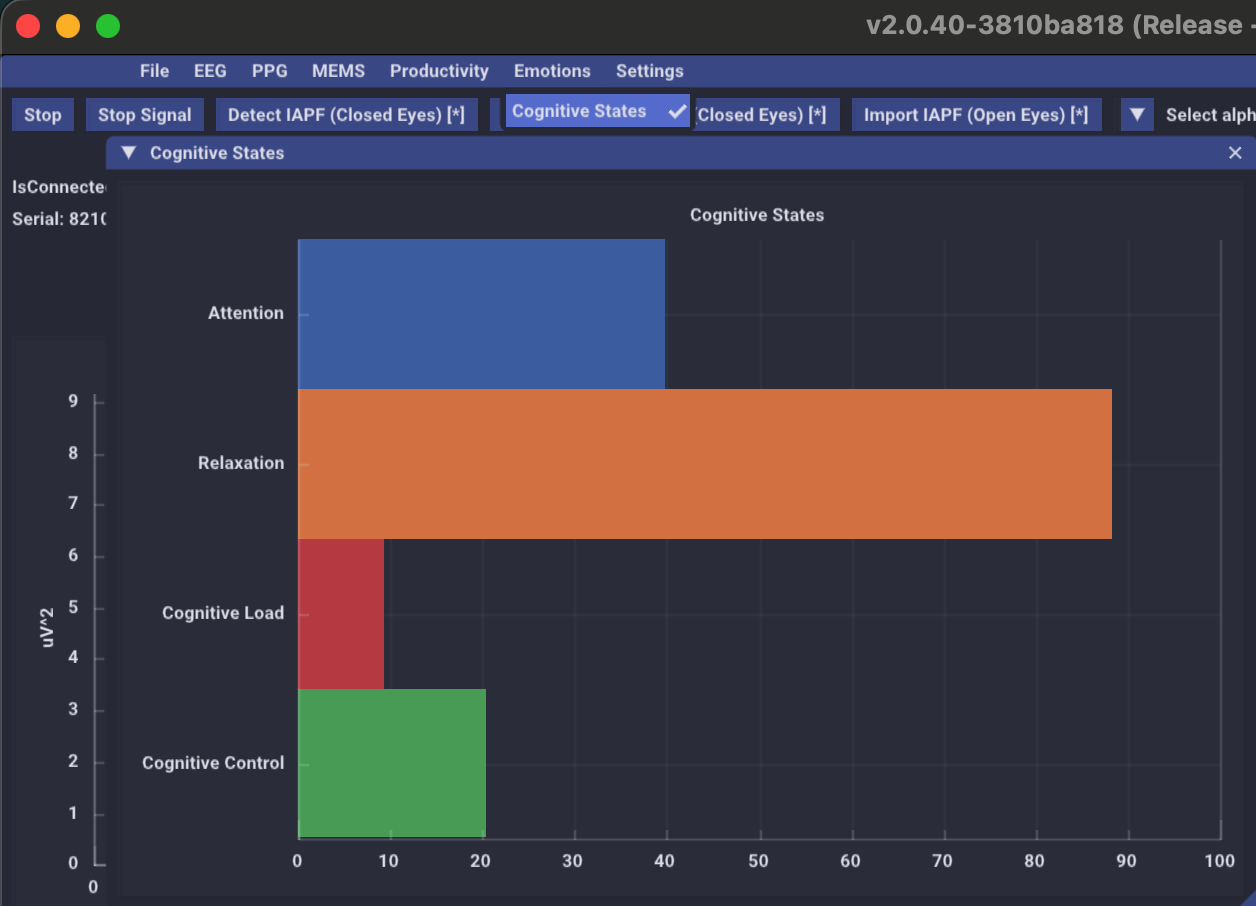
| State | What does it show | Formula |
|---|---|---|
| Attention | Focus, involvement, attention | beta/alpha |
| Relaxation | Relaxation | alpha/beta |
| Cognitive Load | Cognitive load - how busy the brain is with a task | theta/alpha |
| Cognitive Control | Ability to manage attention and suppress distracting stimuli | beta/theta |
Export and send data
Export from the program
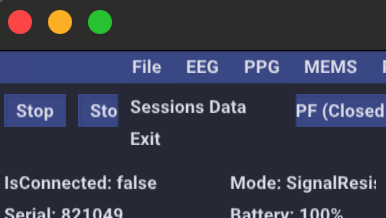
After completing the measurement, export the data. Click File in the upper left corner of the program, then Sessions Data:
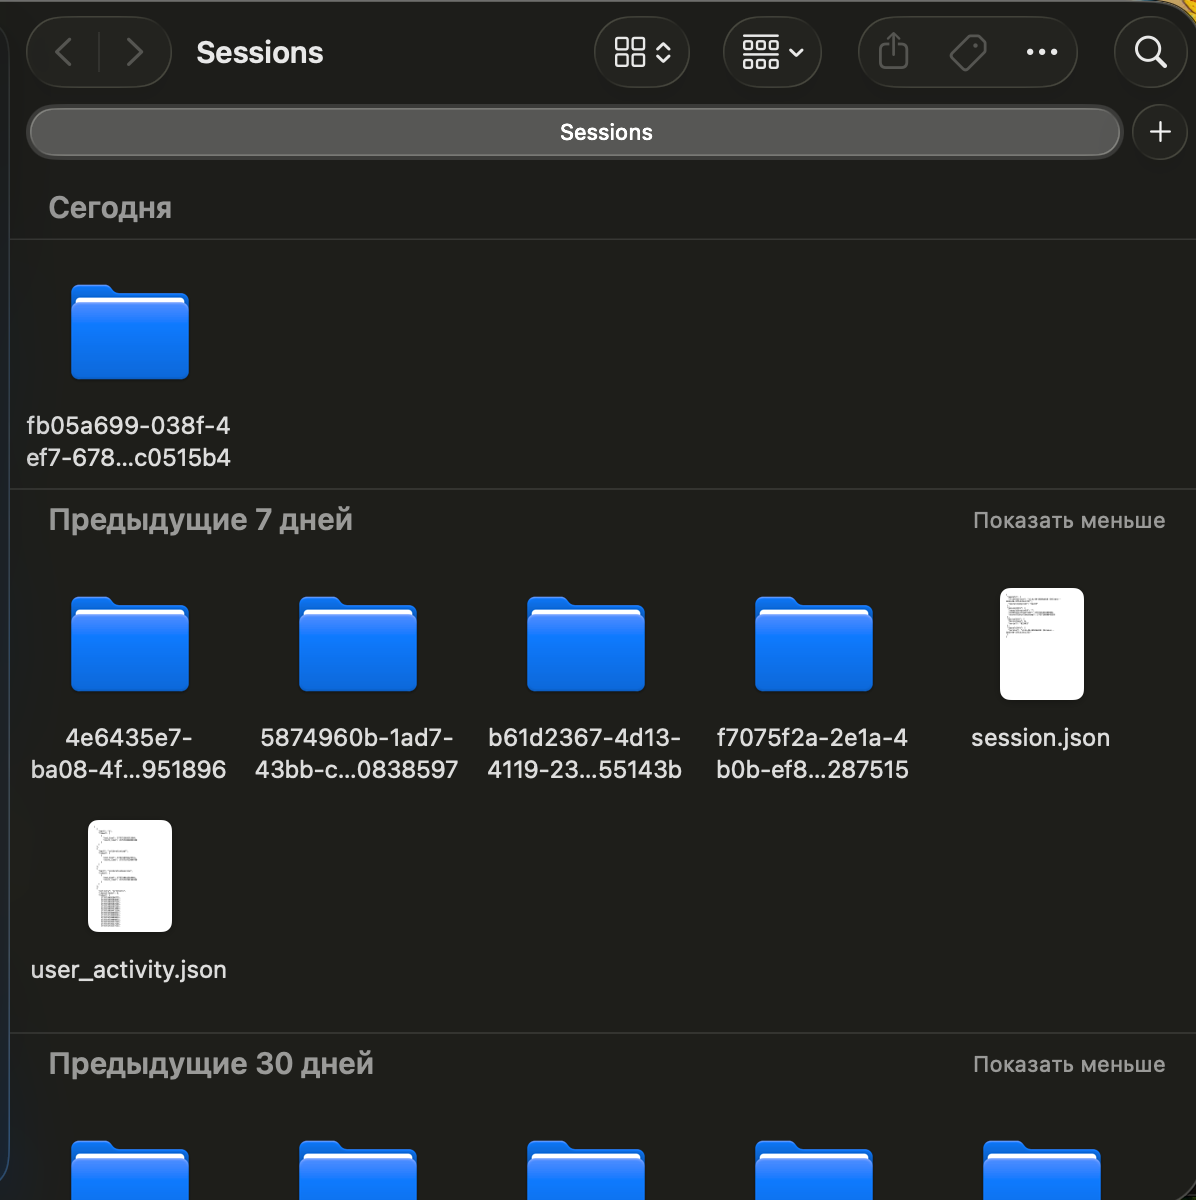
Where is the data stored?
The program saves all sessions to a folder Sessions. Each session is a separate folder with a unique ID (a long set of letters and numbers):
What's inside the session folder
Open the specific session folder - inside you will find three files:
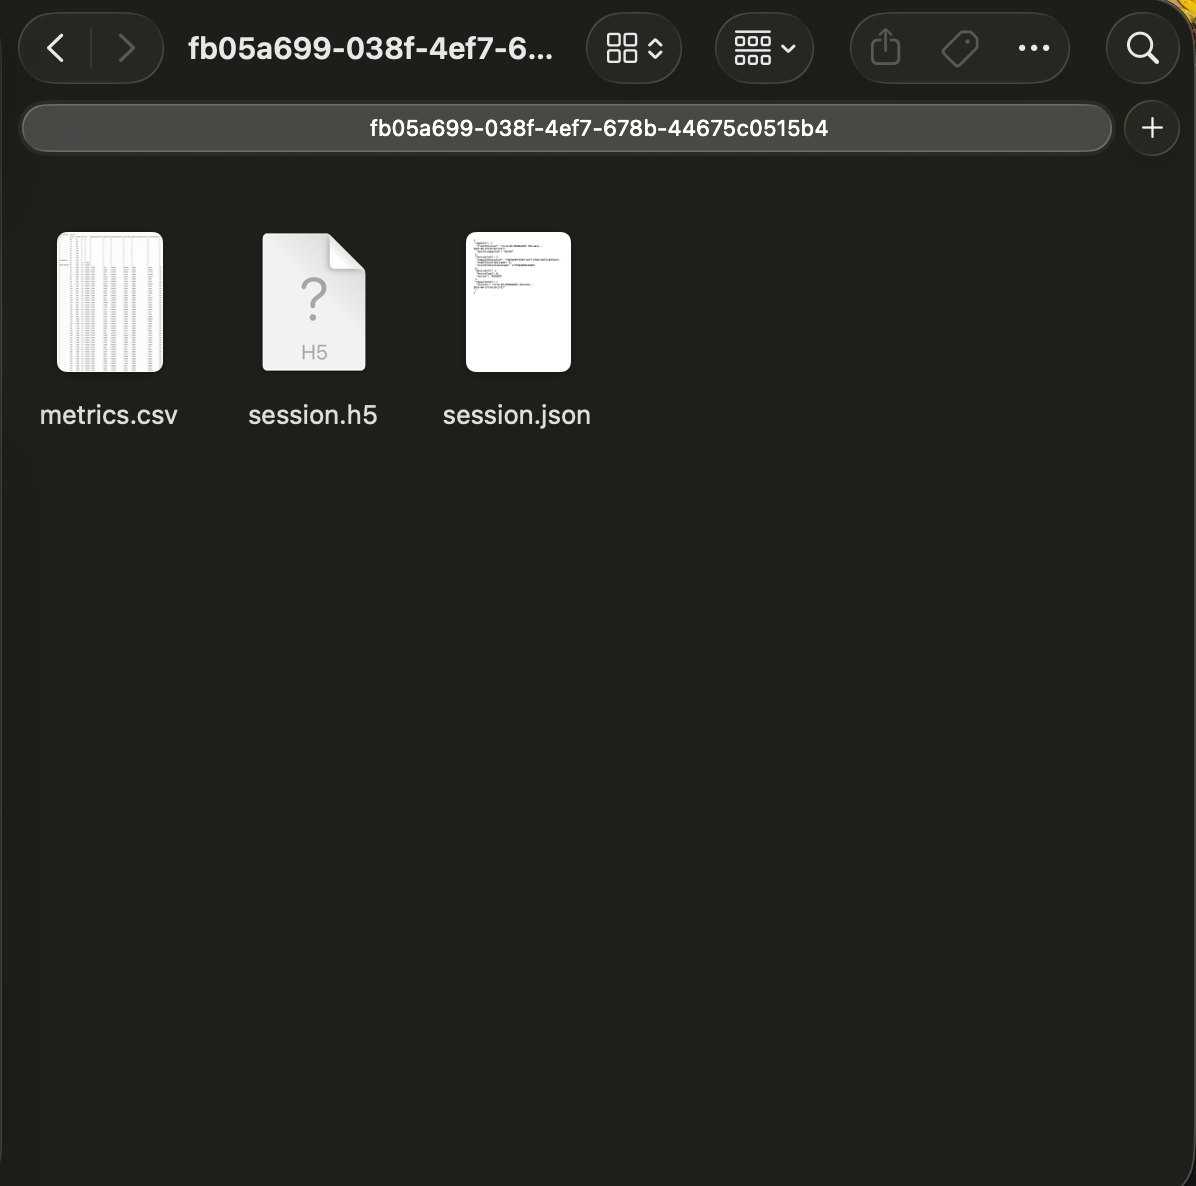
| File | What is this | For what |
|---|---|---|
| metrics.csv | Table with metrics | Main file for analysis. All metrics per second, including Data Markup |
| session.h5 | HDF5 file | Raw signal data (for advanced analysis) |
| session.json | JSON file | Session metadata (time, settings, parameters) |
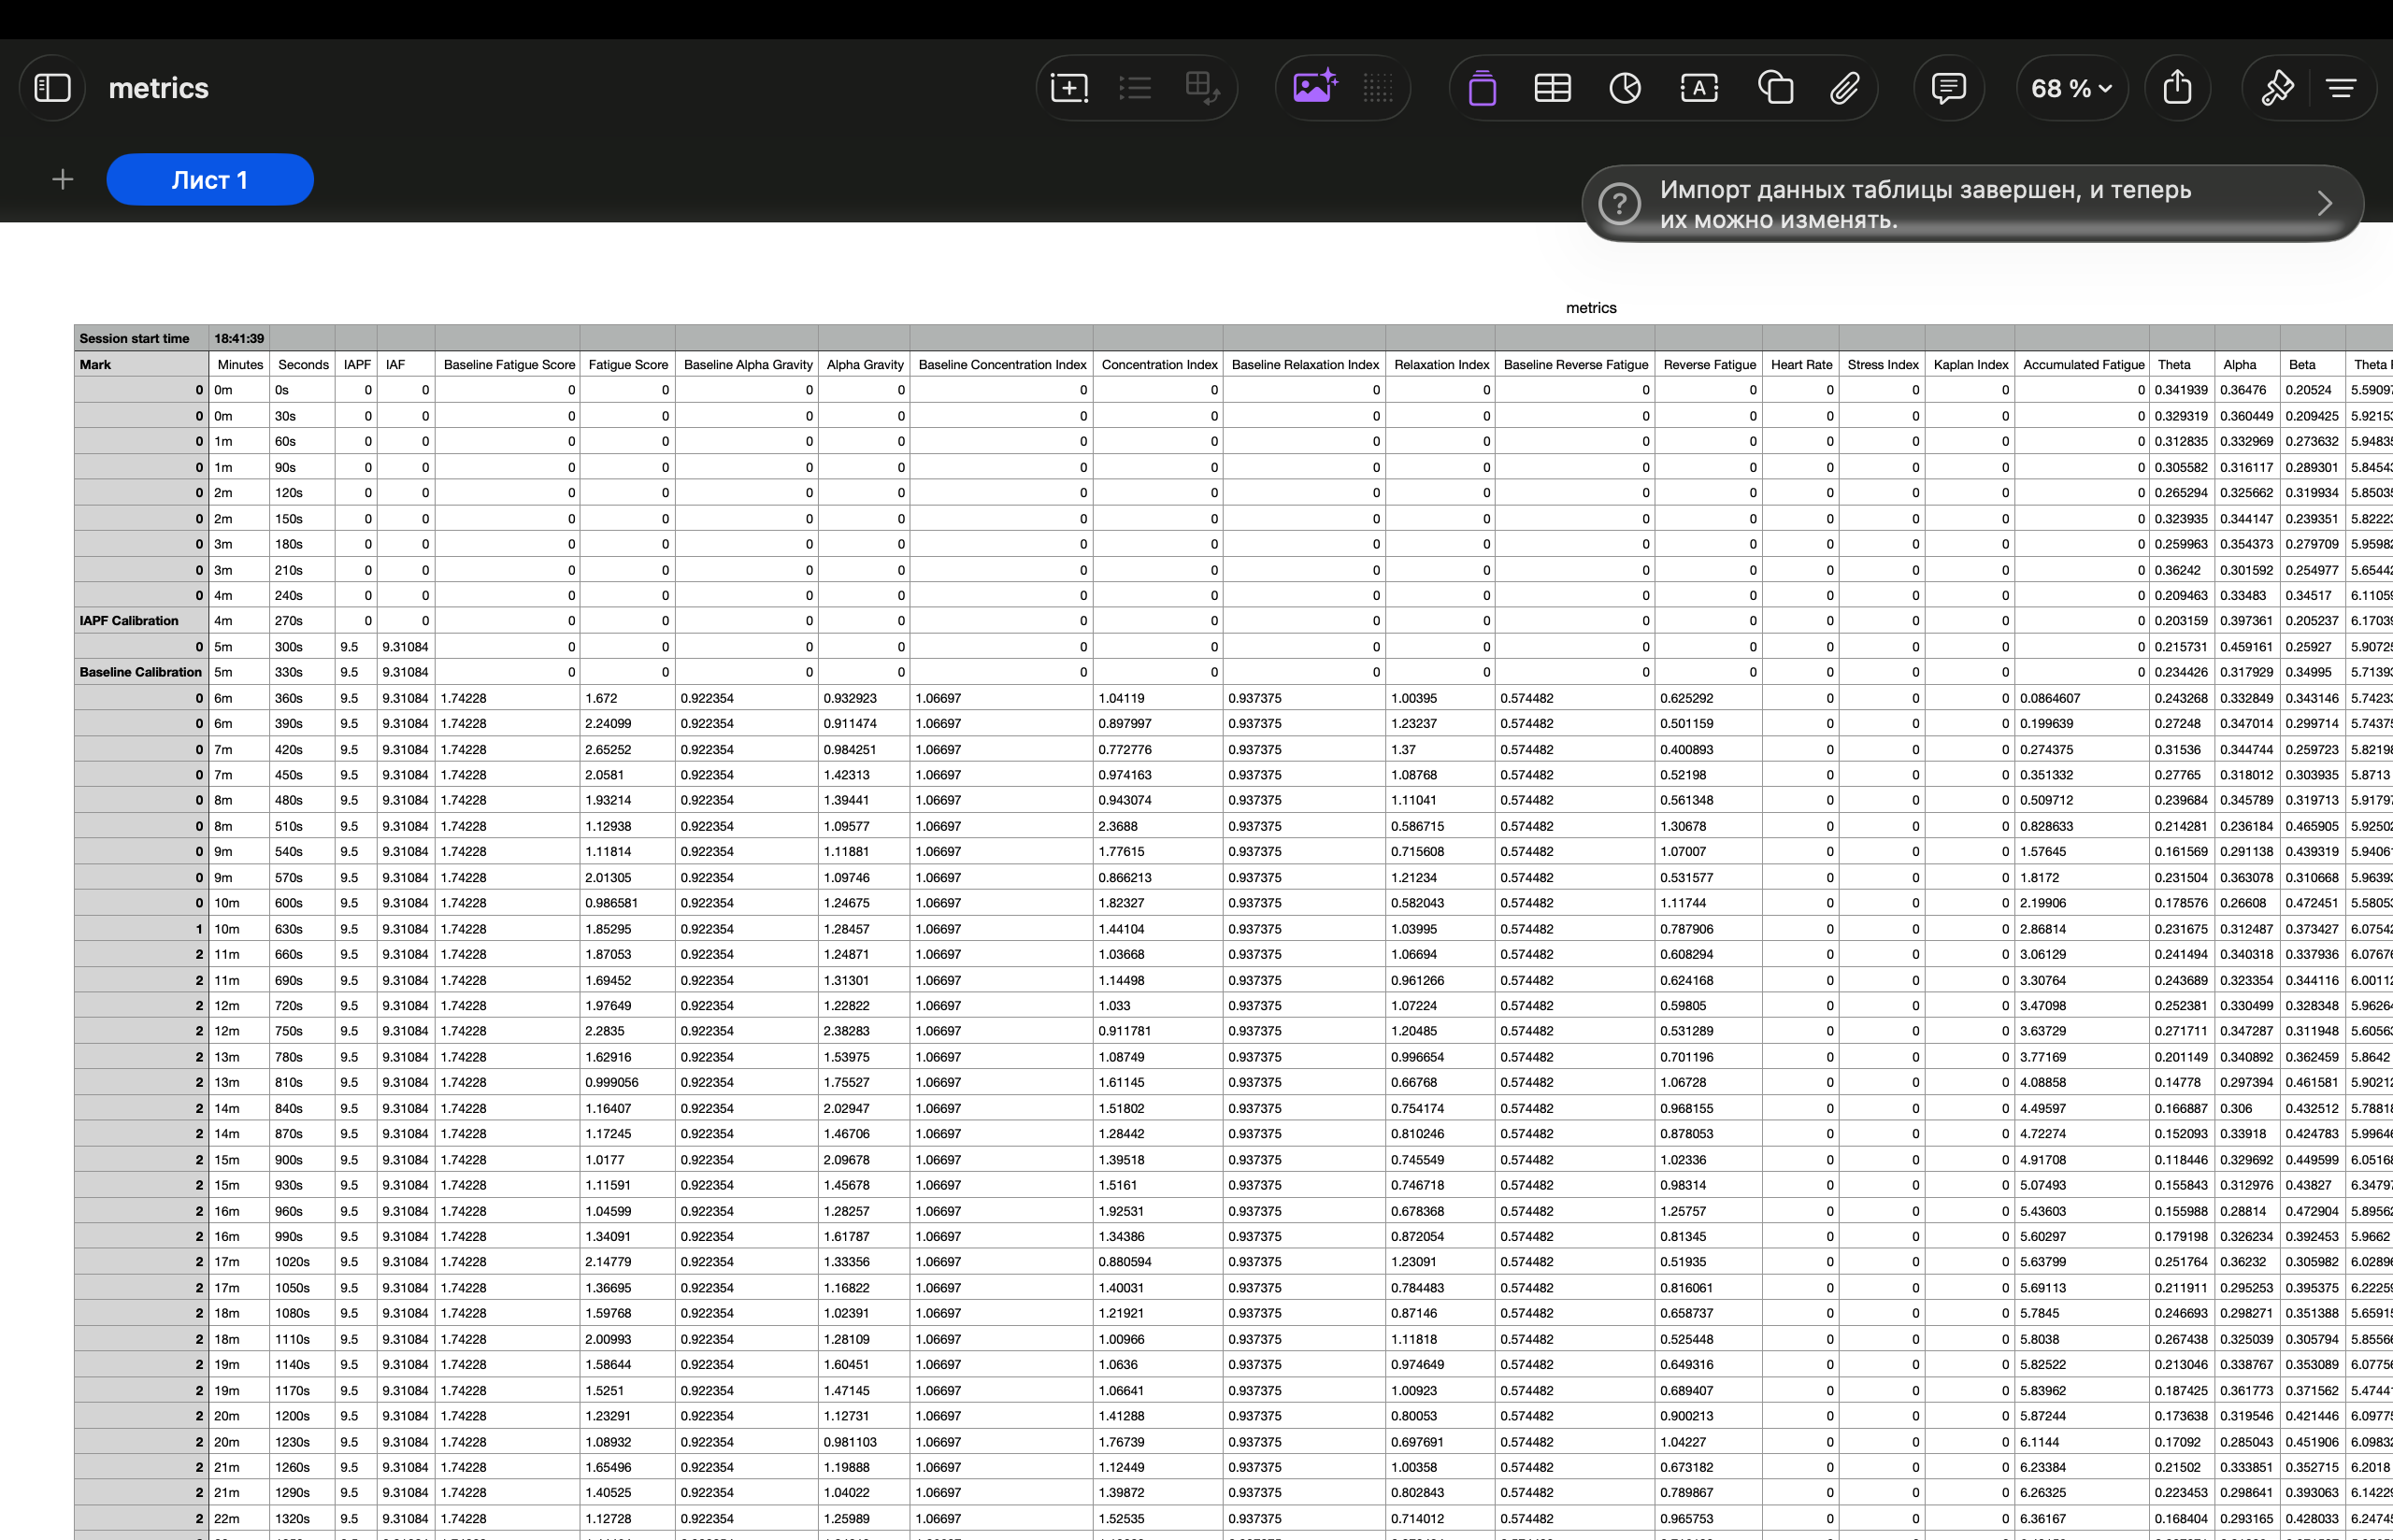
What will be in the CSV file
File metrics.csv is a table where each row = 30 seconds of recording. The columns contain all the metrics you checked in Write Options:
Column Mark - how table marking works
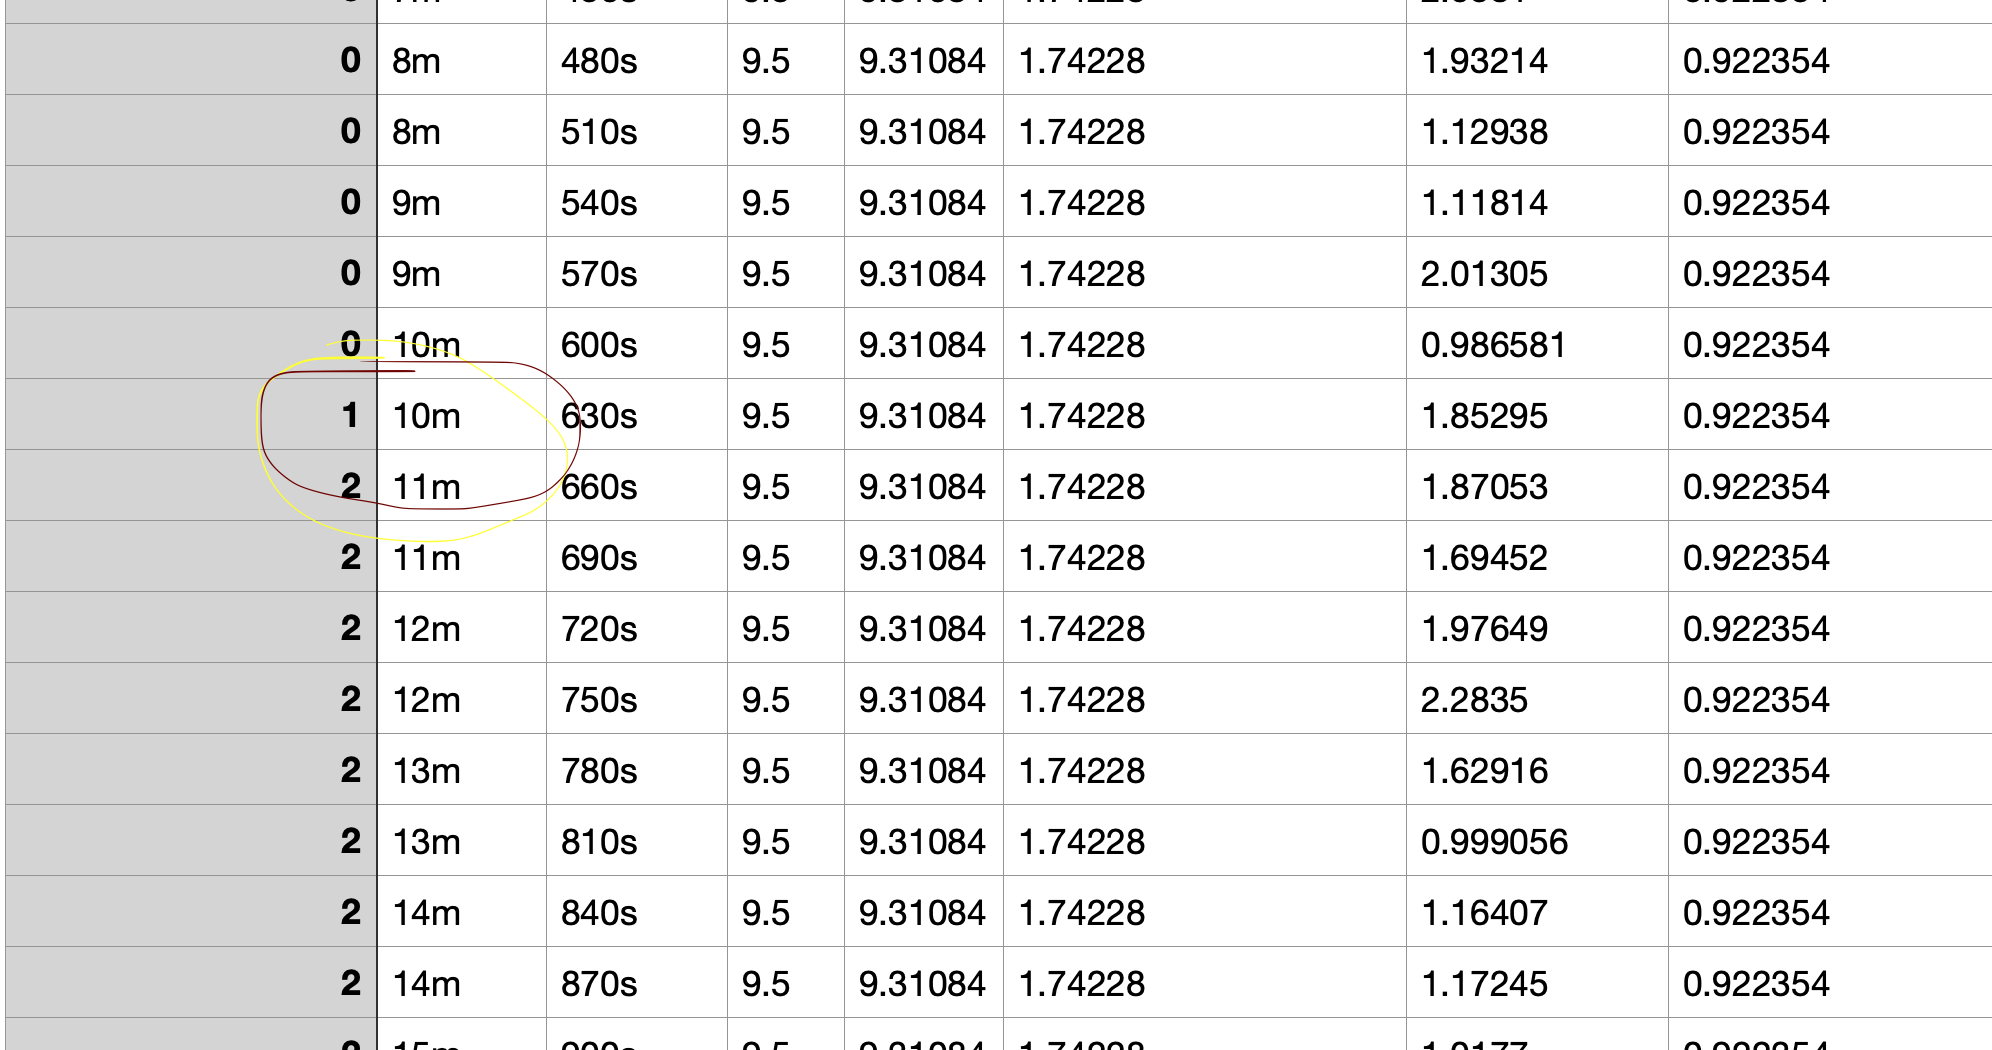
Leftmost column Mark - this is your Data Markup. Look carefully:
How to read:
- Mark = 0 — data before marking begins (can be ignored)
- Mark = 1 — you pressed button 1. This is your normal state (baseline). All lines with this marker are “before practice”
- Mark = 2 — you pressed button 2. This is the target state. All lines with this marker are “during practice”
By comparing the average metric values between phases 1 and 2, you get an objective picture of whether anything in the brain changed during practice.
Sending data to the curator
Exported file metrics.csv send to the research program bot:
Bot: @Konstantinshel
Follow the bot's instructions to download the data.
Typical problems and solutions
The tracker is not on Bluetooth
- Make sure the tracker is in pairing mode (fast flashing - 4 times per second)
- Make sure Bluetooth is turned on on your computer
- If you are using a USB adapter, check that it is inserted and recognized by the system
- Restart Bluetooth on your computer (turn it off and on)
- Turn the tracker off and on again, repeat the pairing procedure
Artifacts = Yes all the time
Artifacts are any change in the EEG signal caused by extracerebral factors: movement, muscle contractions, interference from devices, poor contact.
- Check the fit of the tracker - the electrodes should touch the skin, not the hair
- Remove hair from electrodes
- Pull the bandage tighter
- Don't move your head
- Move away from monitors and electrical appliances
- Clean the electrodes with an alcohol wipe
Low Perfusion (<0.5%)
Perfusion is an indicator of the quality of the PPG signal (pulse). Low Perfusion means that the optical sensor does not “see” the pulse well.
- Press the PPG sensor closer to the skin
- Make sure there is no hair between the sensor and your skin
- Warm the contact area (cold skin = vasoconstriction = weak signal)
- If Perfusion is consistently below 0.5%, stress index data (SI, SAT) will be unreliable
Invalid State
The program shows Invalid State - this means that one or more critical systems are not working correctly. Data in this state cannot be used for analysis.
- Check all contacts (electrodes + PPG)
- Verify that calibration has been completed
- Restart recording
Outliers in data
An outlier is an incorrect numerical measurement that has “slipped” through the artifact filter. For example, if the PPG sensor is poorly pressed and the noise is rhythmic, the algorithm may see false heartbeats. Solution: Make sure the sensor is in tight contact.
Battery < 15%
When the battery is low, the quality of Bluetooth data transmission may be reduced. Charge the tracker before taking measurements.
The program won't run on Mac
macOS can block an application that was not downloaded from the App Store:
- Open System Settings → Privacy and Security
- Scroll down - there will be a message about the application being blocked
- Click “Open anyway” (Open Anyway)
- When starting for the first time, you may need to confirm the action again
The program shows strange data
- Make sure you have completed both calibrations (IAPF + Baselines)
- Make sure Valid State = true
- Make sure Artifacts = No
- Wait 1-2 minutes after starting recording - the data may be unstable in the first seconds
Official support for Neiry - Daniil
If something doesn't work, won't connect, the program shows strange data, or you just need help setting up - you have personal manager from Neiry, which helps participants in our study.
How does this work
- Open the official Neiry support bot: t.me/neirybot
- Write a message - be sure to start it with the name "Daniel", to get to your manager, and not to the general queue.
- Briefly explain the situation, attach screenshots if something does not work.
- Daniil will contact you - they usually agree on short call, where he helps set up and solves the problem live.
Message template
Copy, replace the last line with your description and add screenshots:
What to prepare for the call
- Tracker nearby - if you need to check the connection
- Computer is on, Capsule program is open
- Bluetooth enabled and allowed for Capsule
- Serial number tracker (on the inside of the rim)
- Screen sharing option — in Telegram or through a method convenient for you
Daniil helps with: obtaining an activation key, installation errors, pairing problems, calibration, data interpretation and any technical questions regarding the tracker and the Capsule program.
Useful links and contacts
Channels and bots
| Resource | Link | For what |
|---|---|---|
| Channel Neiry Capsule | t.me/neurocapsule | Downloading the program, updates, requesting a key |
| Tech bot. Neiry support | t.me/neirybot | Questions about the program. Start your message with the manager's name - Daniel |
| Research bot | t.me/Konstantinshel | Sending measurement data |
Documentation
| Resource | Link |
|---|---|
| Video review of the Capsule interface | Yandex.Disk |
| Complete scientific guide to metrics | exnihilo.life |
Curator contact
For any questions related to the ONTO NOTHING research program, please contact Konstantin Shel — via Telegram @Konstantinshel or in private messages.