ex NIHILO - a platform for your own research of yourself and your method
ex nihilo · self-exploration platform

Your research -
without institute

A place where a person examines himself or his own method: instruments, world clinical scales, own indices NSI and MNPI and reports that accumulate into an evidentiary history.

191
participant
1 022
reflections
209
EEG sessions
2 314
AI analysis
26
clinical scales
For whom and why did it appear?

Private study
ran into the same thing

The platform is made for those who explore themselves or their own method: masters, presenters, coaches, methodologists - and for their people.

How it was
  • The data lies in five applications, and no one brings them together.
  • Measurements are taken from case to case - there is nothing to compare and nothing to compare with.
  • The result of the method depends on reviews: it cannot be proven, nor can it be transferred to another specialist.
  • Gathering a cohort, leading it and storing everyone’s history is a job for which there is neither time nor tools.
How did it happen?
  • Devices, words and tests converge into one profile and one analysis.
  • The measurement follows the protocol: point A, cycle, point B - with dates and rules.
  • Each check turns into a report, reports are accumulated into history, and a case is assembled from history.
  • The master receives a cohort, flow analytics and evidence base for his method.
It's already working

Platform in numbers

Live contour data as of August 6, 2026. The first participant entered on April 24.

191
participant in the system
everyone has their own profile
1 022
reflections in voice and text
raw materials for analysis
209
EEG sessions on neuroband
objective layer
2 314
analysis generated by AI
each has its own text
94
clinical tests passed
26 scales in the catalog
978
days of data from trackers
sleep · heart rate · HRV · load
98
chapters of the “Book about the Hero”
weekly and monthly
15
students in cohorts of masters
other people's research
What the platform brings together

Three truths.
One picture

The tracker knows the pulse, but does not know what was in the head. The diary remembers the meaning of the day, but does not know what the body was doing. The test gives a score, but does not say why it is so. Until the three layers are brought together, the change is either not visible or is explained in hindsight.

The analysis is reassembled every day and puts the number next to the phrase from the diary of the same period. The AI ​​doesn’t give advice here—it reflects what followed what and what coincided with what.

number next to the phrase
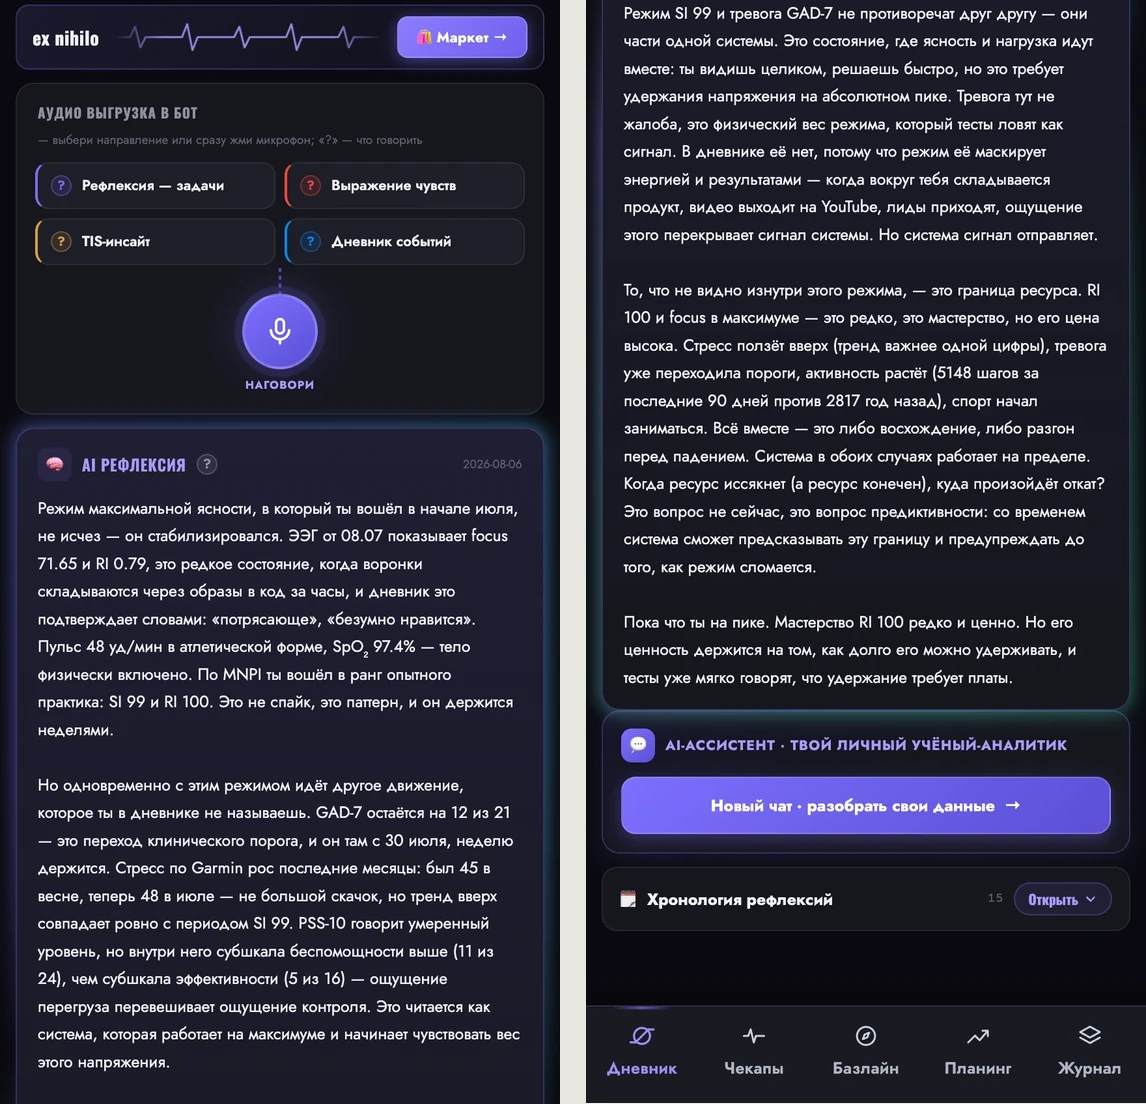
AI reflection widget: EEG, diary and scales in one text
AI reflection · analysis of the day in three layers
DEVICES
Body and Brain
Neuroband EEG, watches and fitness trackers, PPG scanner, rhythm variability sensor. Objective layer: it cannot be argued by self-report.
WORDS
Context
Voice reflections, diary of events, expression of feelings, insights. A layer of meaning: it explains why the number is the way it is.
TESTS
Psyche
Validated scales with known norms. Comparison layer: It puts the result on a scale rather than a feeling.
Study design

It all starts from point A

01
Point A
Snapshot “as it is now”: instruments, voice, scales, EEG. The express version is assembled in 15 minutes, the full version is assembled in six stages.
02
Cycle
40 days of life and practice. Every day, recordings are accumulated: voice, measurements, marks - raw materials for analysis.
03
Point B
Repeated measurement with the same tools. Only State scales are retaken—those that can change at all during the cycle.
04
Dynamics
The difference A ↔ B is the result. Not “it seems to me that it has become easier,” but a shift on specific scales.

This is a classic within-subject design: person is his own control group. They compare not him with others, but with him today - with him forty days ago. There should be a pause of at least two weeks between measurements, otherwise the difference will turn out to be noise and not an effect.. The rule is hardwired into the screen, and not left to the conscience.

Application inside Telegram

Five screens
not a single unnecessary thing

Placed on your phone's home screen. There is no need to download a separate application - everything lives in the messenger.
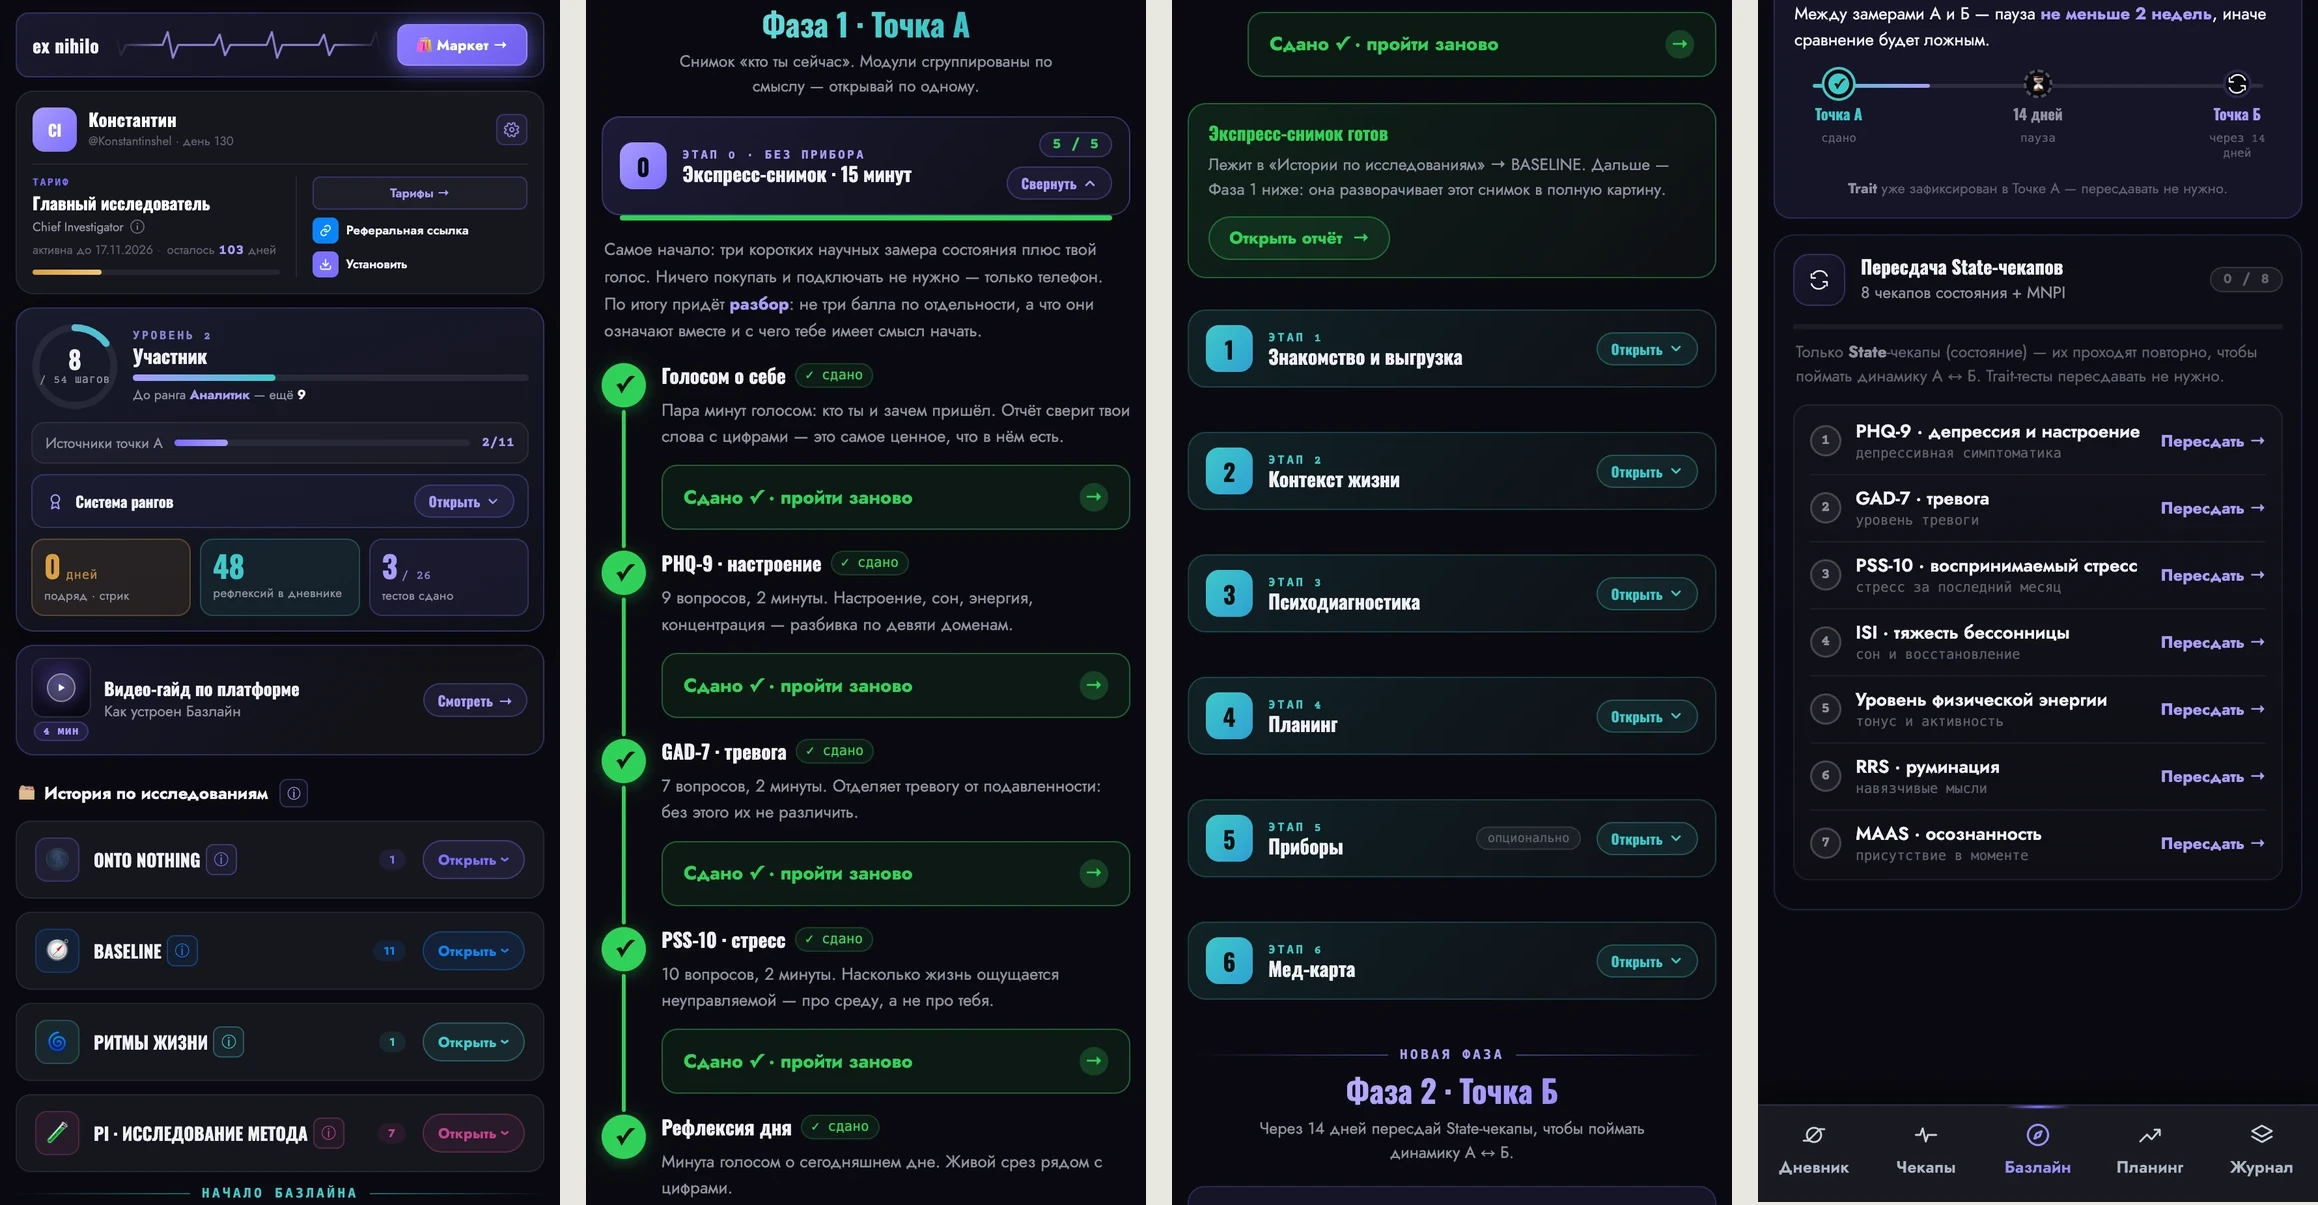
Baseline
Baseline Screen
Point A is collected here: what is connected, what is left to go through and when the re-measurement will occur.
Diary
Diary Screen
Here you are talking. The voice goes into the bot, and an analysis of the day comes back and a chat using its own numbers.
Checkups
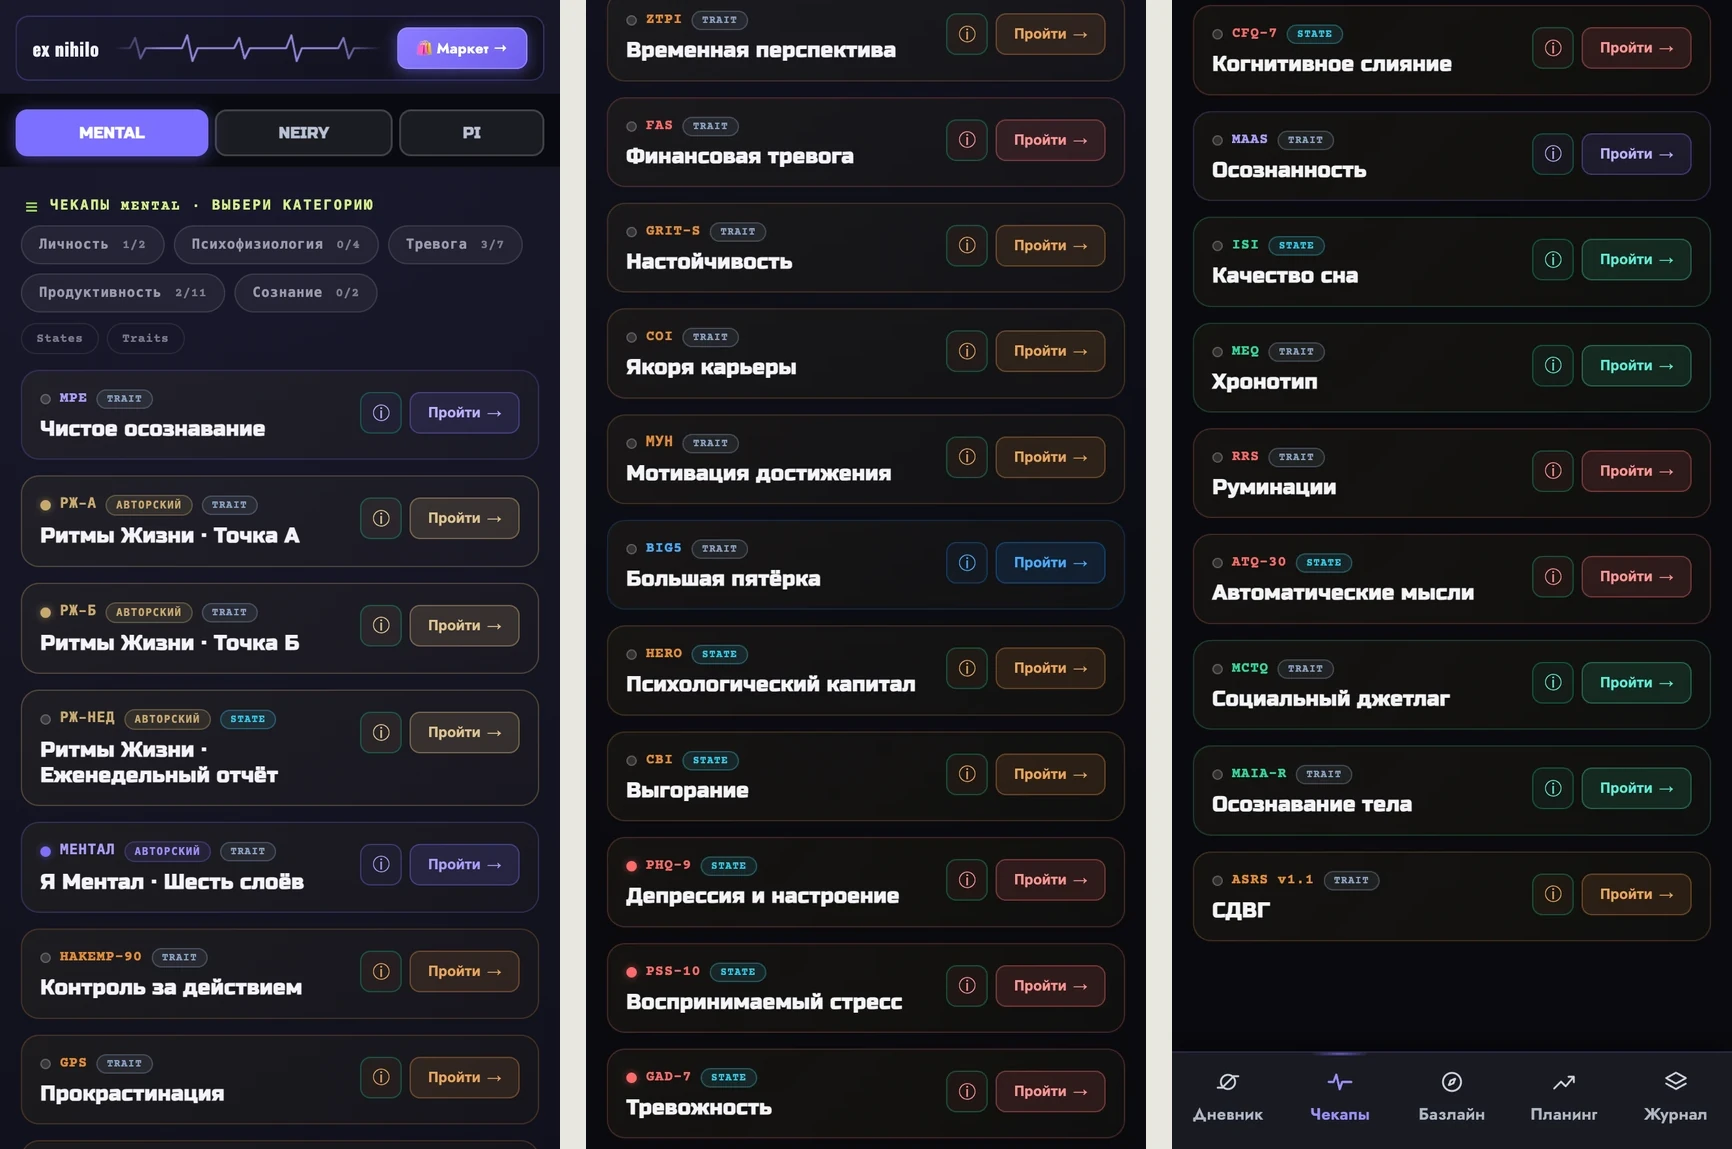
Checkups screen
Here you measure: clinical scales, EEG protocols and questionnaires to describe your method.
Planning
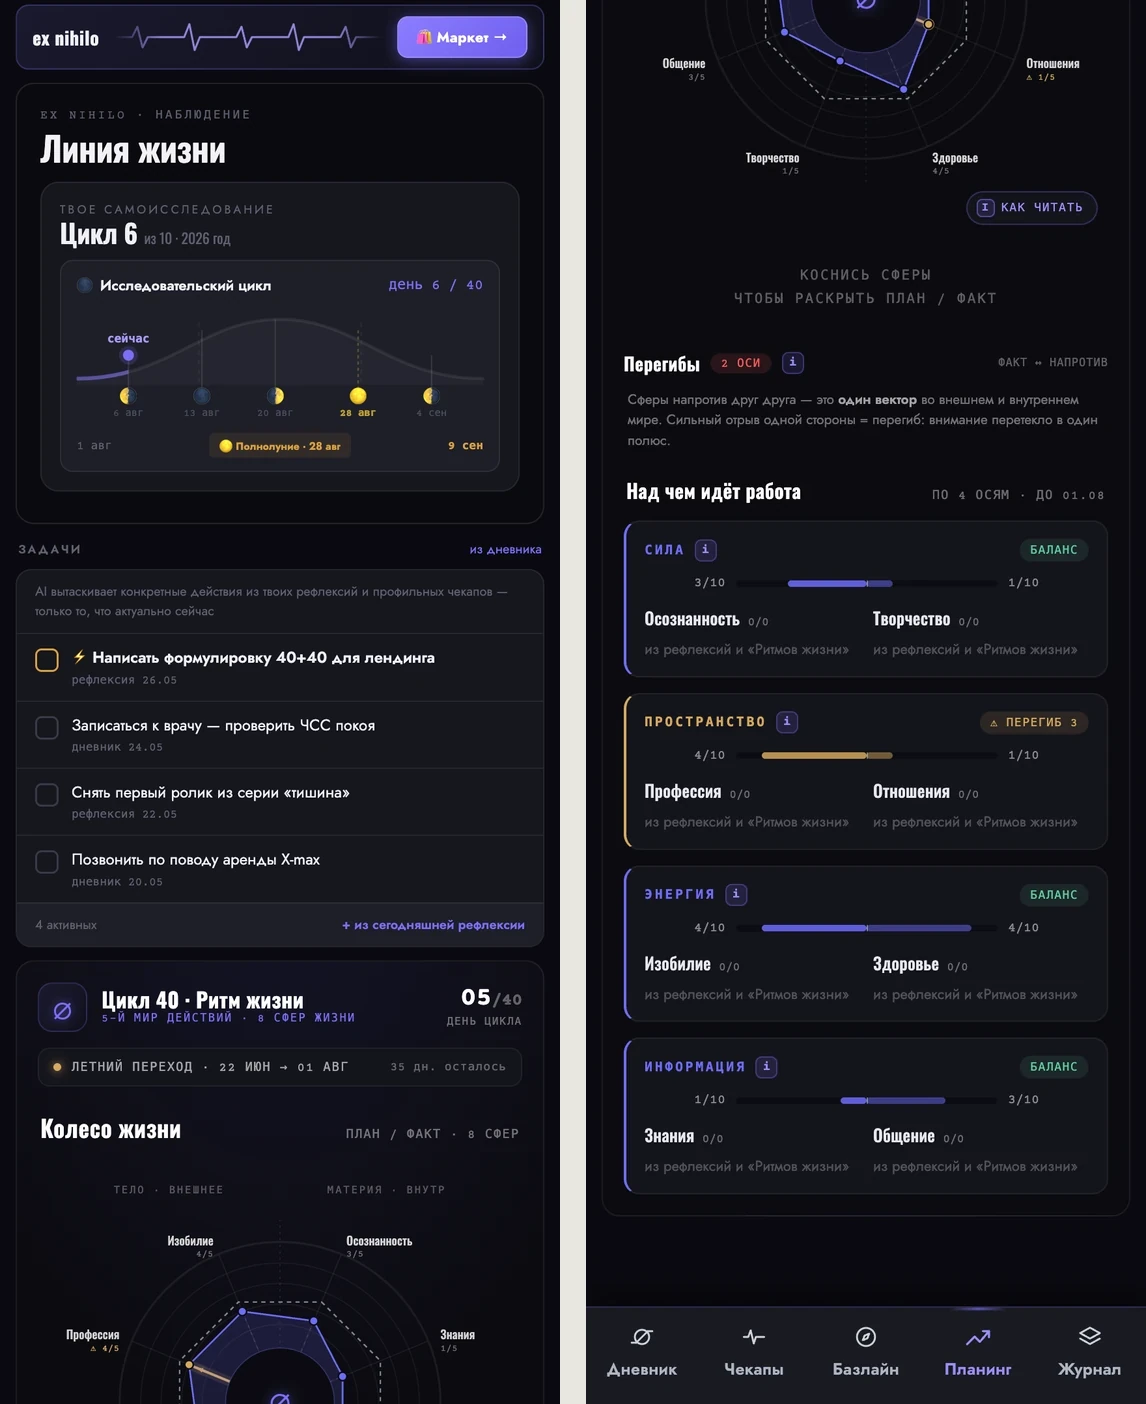
Planning Screen
Here you can see the discrepancy: what you were going to do in the cycle and what actually happened, in eight areas.
Magazine
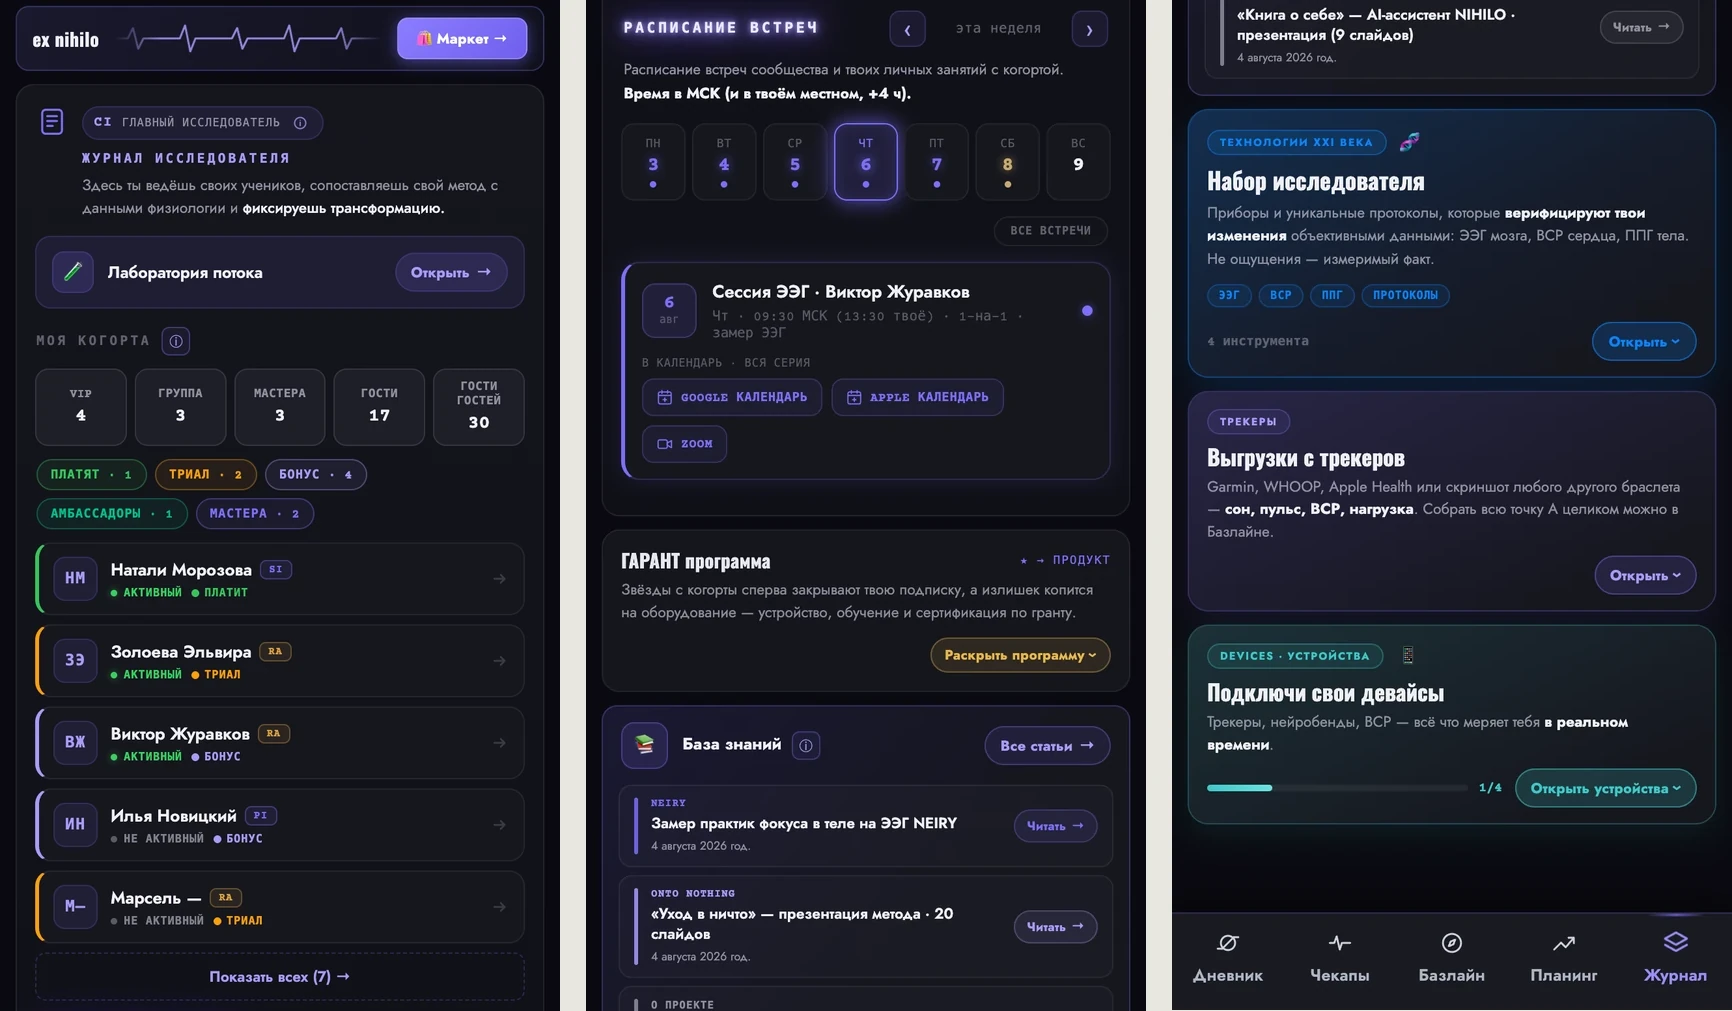
Screen Log
The master works here: cohort, each student’s page, flow analytics and schedule.
Tools

The same scales
from world studies

These are not author's questionnaires. Each instrument is published, validated and used in clinical practice - so the result has the norm to which it can be compared.

PHQ-9
Depression and mood. Kroenke, Spitzer & Williams, 2001 — the most common depression screening in primary care.
GAD-7
Anxiety. Spitzer, Kroenke, Williams & Löwe, 2006 — standard for generalized anxiety screening.
PSS-10
Perceived stress. Cohen, Kamarck & Mermelstein, 1983 — forty years in stress research.
Big Five
Personality. IPIP Big-Five Factor Markers, Goldberg, 1992 - an open version of the most established personality model.
And 22 more
ISI · MEQ · MCTQ · MAAS · RRS · ATQ-30 · CFQ-7 · CBI · Grit-S · ZTPI · ASRS v1.1 · Career Anchors · MPE-92M - in five categories, each with its own summary report.
Own metrology

NSI and MNPI -
scales that are not found anywhere else

Neurobend gives off a raw, minute-to-minute flow. Everything else is platform metrology: two indices that turn the graph into a number comparable with your last time and with other participants.

NSI = ⁴√( Speed ​​· Depth · Hold · Stability ) × 100

If you fail any edge, the entire index falls. MNPI is calculated based on the entire series of measurements: speed, depth, retention under load and phenomenology. Rank is based on peak and retention immediately, and the empty axis is honestly written as “not measured”, and is not silently underestimated.
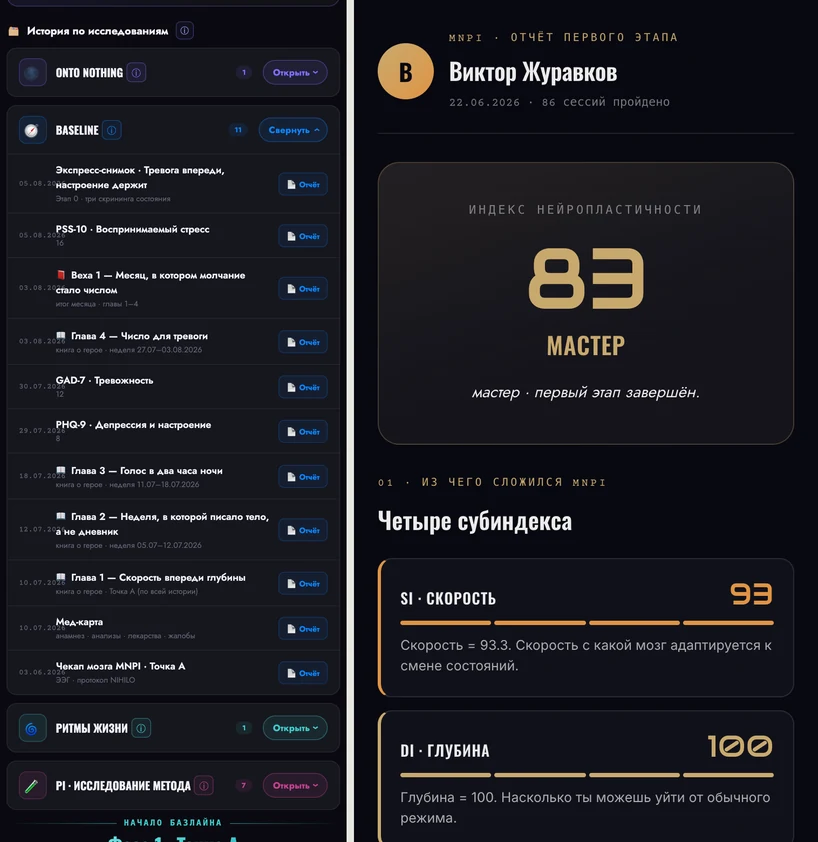
Chronology of reports and MNPI index
Reports are accumulated in history → an index appears
The main thing is what everything else is for

Measurement becomes text

The score itself doesn't change anything.. The meaning comes when it is turned into parsing that you can read and recognize yourself. This happens after each measurement, automatically, on the same day.
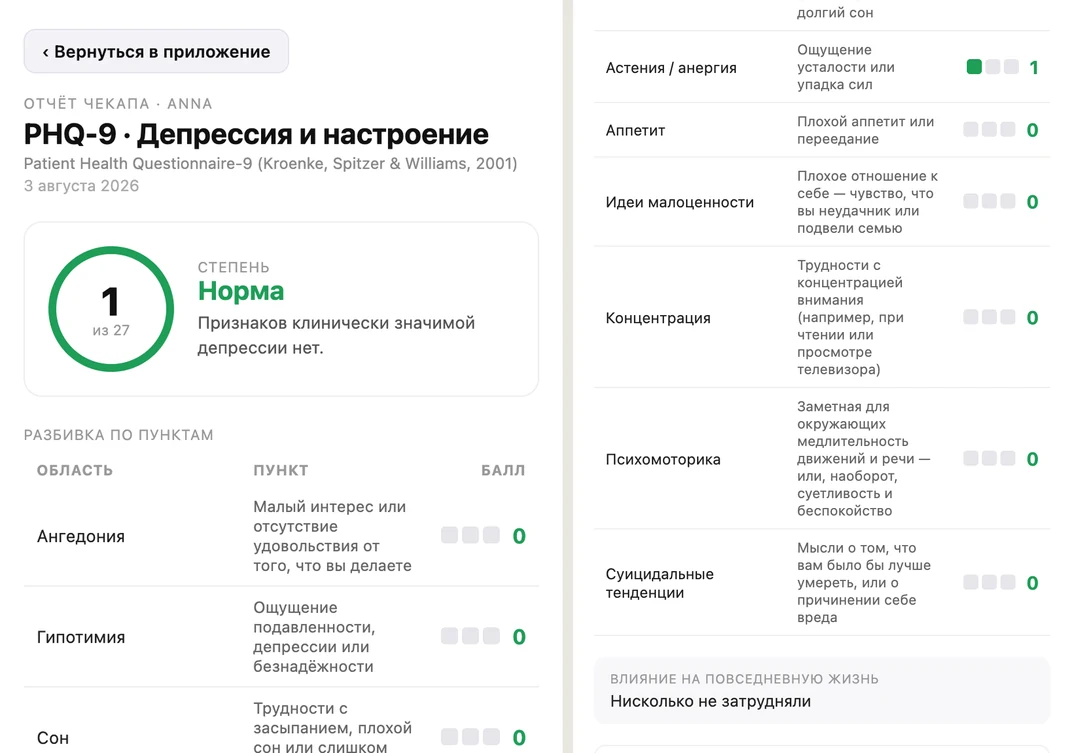
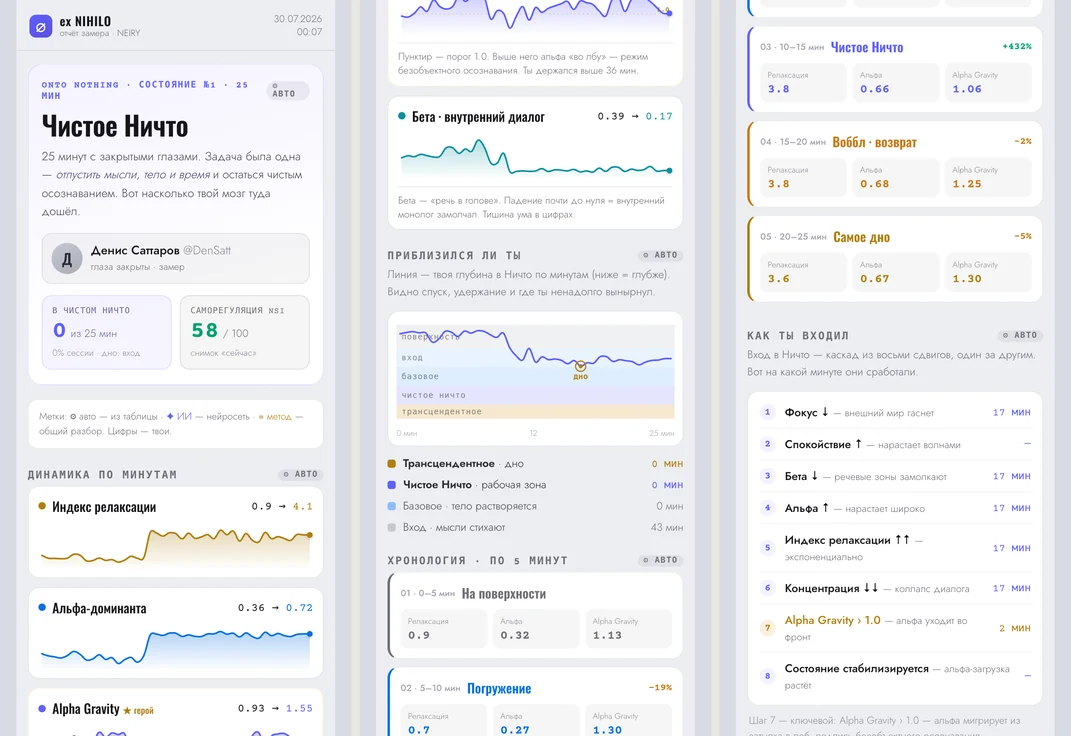
Checkup report PHQ-9
Checkup report
EEG session report
Analysis of the EEG session
Chapter of a book about a hero
Book about a hero
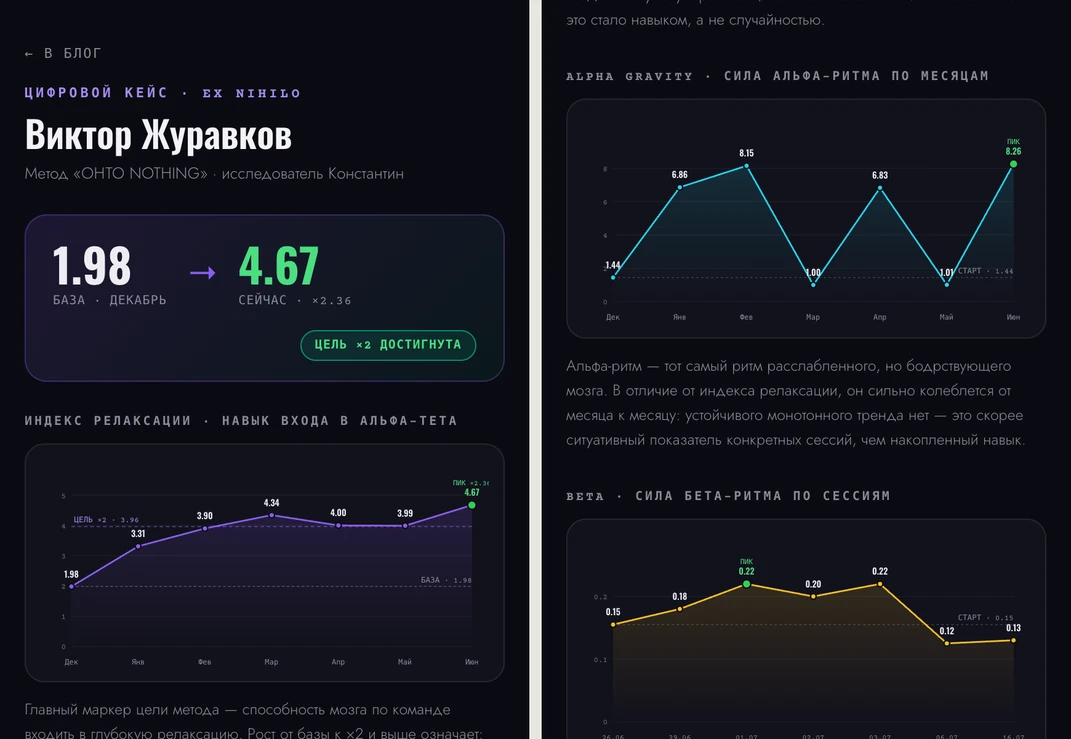
Digital student case
Digital case
RULE 1
Numbers are counted by code
The model works only with already calculated values ​​and explains them. Otherwise, the report contains beautiful but fictitious statistics.
RULE 2
No data - no text
Zero entries for a week - a short “letter of silence” without addressing the model, and not a fictitious analysis.
RULE 3
There is an entry threshold
The book is not compiled for everyone: without a minimum of data, a coherent text about nothing will come out - and trust in the rest will be lost.
What is already verified on the platform

Two methods
one toolkit

Method 1 · Konstantin Shel

ONTO NOTHING - ×2 to brain function

State teaching method, which has no content: no thoughts, no images, no experience of oneself as separate. Eight modes, verbatim practice protocol, safety section.

The stated result is ×2 in alpha rhythm and relaxation index, +50–100% in brain metrics per cycle. This is not a sense of self: Victor’s EEG relaxation index increased from 1.97 to 4.2–4.8 over 65 measurements, tripling in peak sessions.

Method 2 Natalie Morozova

Rhythms of Life - a year is like eight cycles

Planning methodology that synchronizes actions with natural cycles. A year is not 12 random months, but 8 periods of approximately 40 days, each with their own energy and their own task.

You act at your own pace - less self-abuse and more results with less effort. Inside the platform, this is the line of life, the wheel of eight spheres and the analysis of kinks, and is measured by its own “Point A / Point B” checkups.

Two methods on one platform is the proof of the model: the toolkit is not tied to one author. Any master can follow the same path for his own method - the PI circuit is exactly about this.

How do we measure the body and brain?

The method is proven by instruments,
not reviews

Each device covers its own layer of physiology. Not a single one is sold on its own - only together with research and analysis: a gadget without a protocol produces graphs from which nothing follows.

NEIRY - neuroband EEG
EEG · brain

NEIRY

Electrical activity of the brain every minute: alpha, theta, beta and derivatives - relaxation index, dominant, stress index. Removal accuracy 97%. The platform contains 11 protocols, a report for each session, and NSI and MNPI indexes.

from 74,000 ₽ · with course and protocol
PPG body 24/7

NEYROX

15 parameters around the clock and composite stress index; developed in the Skolkovo laboratory, PPG accuracy - 97%. The only source that writes without interruption: it catches the delayed effect between practices.
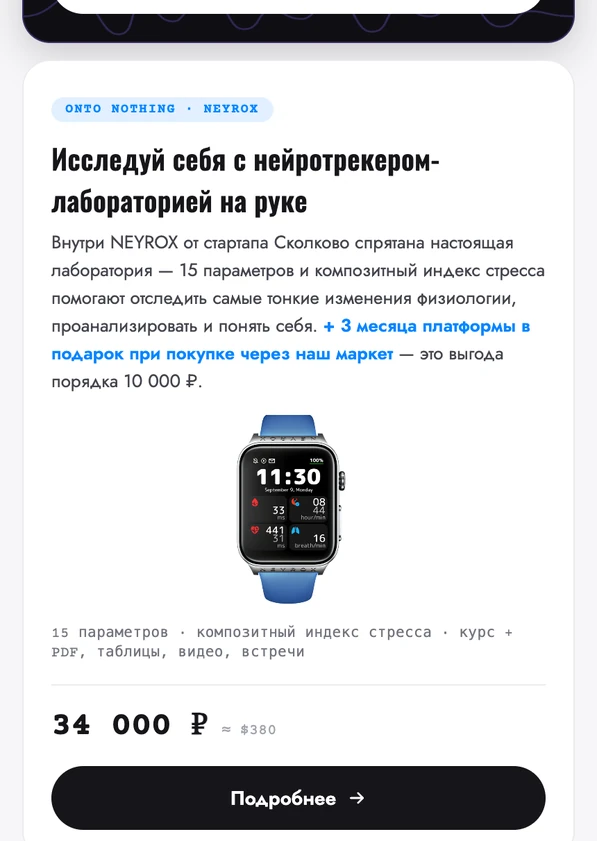
34 000 ₽ · +3 months of platform
NEYROX - neurotracker-laboratory on the hand
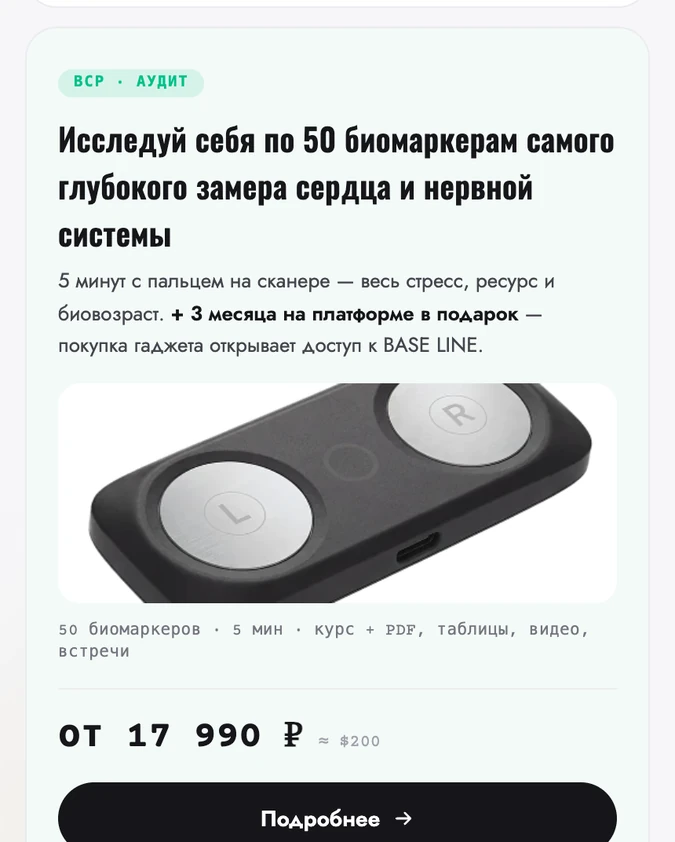
LQ Lab - PPG scanner
HRV · nervous system

LQ Lab

Finger on the scanner - and 50 biomarkers deep measurement of the heart and nervous system: stress, resource, bio-age, balance of sympathetic and parasympathetic. Five minutes instead of a half-hour session is an ideal reference point between larger measurements.

from 17,990 ₽ · opens BASE LINE
Changing optics

Next - for the master

Everything above works the same for any participant. For those who conduct their research on others, a separate screen opens: cohort, page for each student, flow analytics and GARANT program.
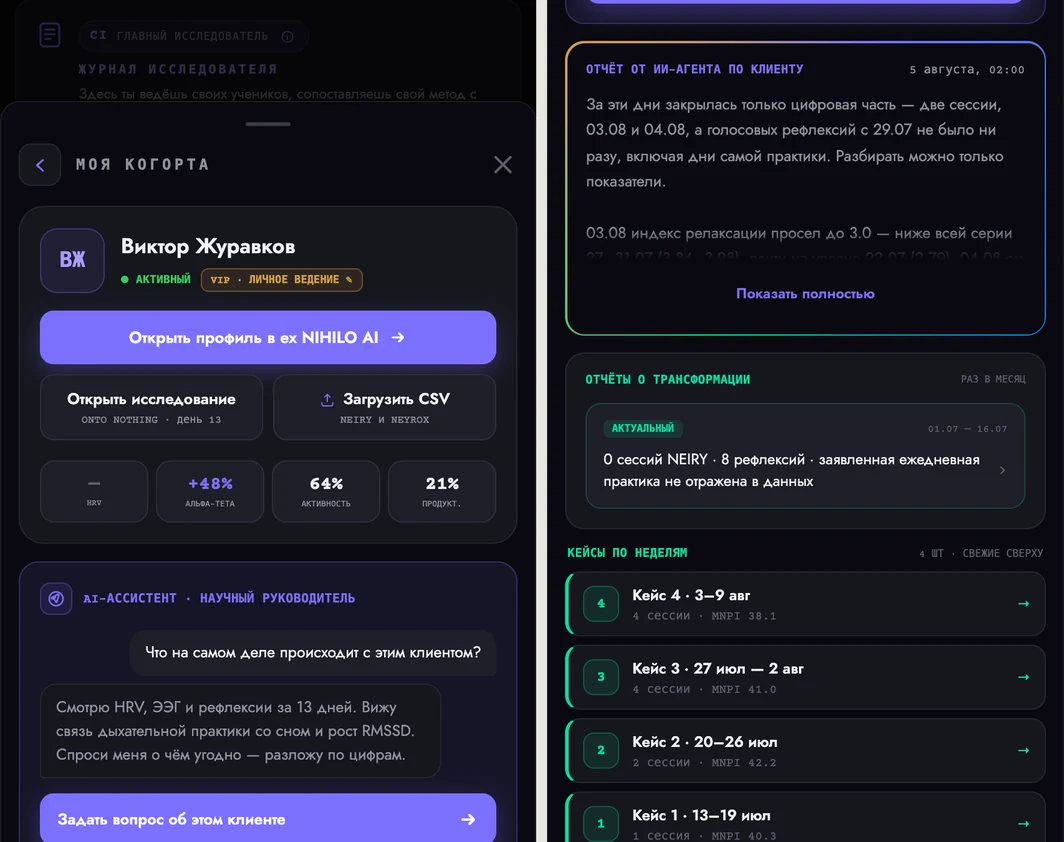
Student Inner Page
Student page · metrics, hypotheses, weekly cases
Cohort
Five people tabs - VIP, group, masters, guests and second circuit. Each one has two different axes visible: role in the study and access status.
Student
Own page: four metrics, AI in the role of scientific leader, transformation reports, weekly cases and progress towards the goal with a work hypothesis.
Laboratory
Analytics of the entire cohort: Sunday report with patterns and confidence levels of hypotheses, completeness of data for each and protocol funnel.
GUARANTEE
The stars of the cohort first close their personal subscription, the surplus is saved for the device under a grant of −40%. This is the path to status ambassador.
Separate circuit

Your method
becomes provable

Five questionnaires describe the author’s method: method passport, audience and design, scientific foundation, master’s path, invitation to research. You can answer by voice - the analysis itself brings the answers into a scientific form.

At the exit - method dossier (hypothesis, convergence, risks, readiness to start) and method book: A cohesive document that can be shown to a client, colleague, or committee.

Flow Laboratory report
Flow laboratory · auto-report on Sundays
What's in total

Study,
which can be shown

Point A is assembled in 15 minutes and unfolds into a complete map. The three layers converge on their own. Measured by world scales. Each measurement becomes a report, reports are accumulated into history, an index, book and case are collected from history.

Screenshots taken from live profile August 2026